“Together with MapGear (ESG-Maps) we built a realistic solar potential forecast for Groningen in 2035 - combining data on roofs, heat pumps, electric driving and policy choices.”
Together with MapGear (ESG-Maps) we built a realistic solar potential forecast for Groningen in 2035 - combining data on roofs, heat pumps, electric driving and policy choices.
Joris van de Ven
Syntraal
Trusted by municipalities, provinces and organisations in the Netherlands and Belgium























































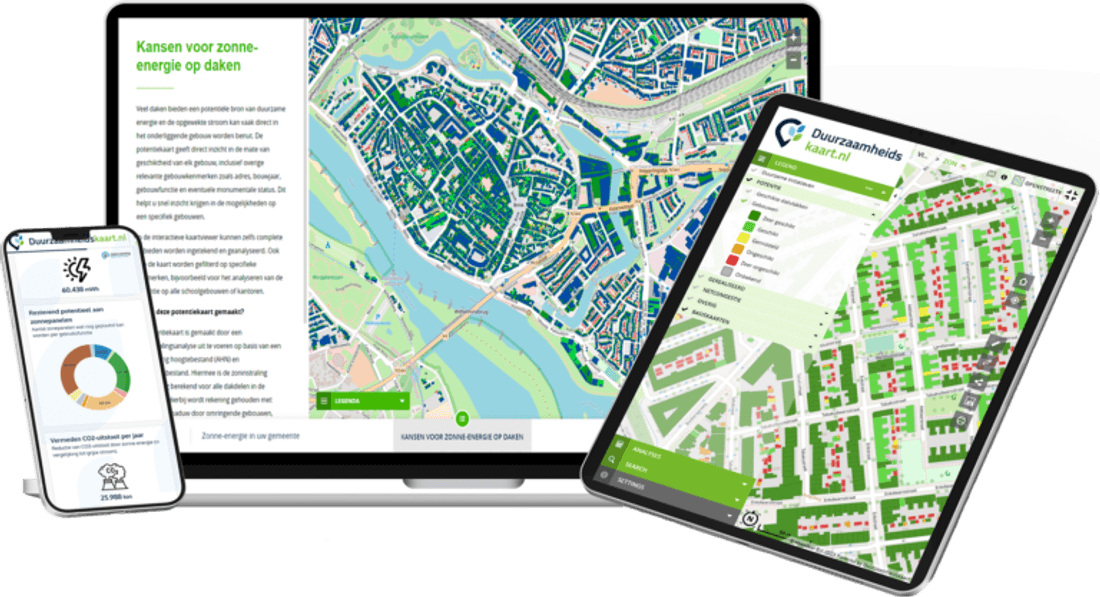
Effective policy requires up-to-date data on realised solar capacity. Our detections show where solar panels are installed, their estimated capacity and the remaining roof potential at building and neighbourhood level.
Accurate
≥95% accuracy
Current
Annual refresh
Easy to integrate
GIS & portal integration
We combine up-to-date nationwide aerial imagery with automated detection and manual quality control to create a reliable national dataset of solar panels, estimated capacity and links to buildings and administrative boundaries.
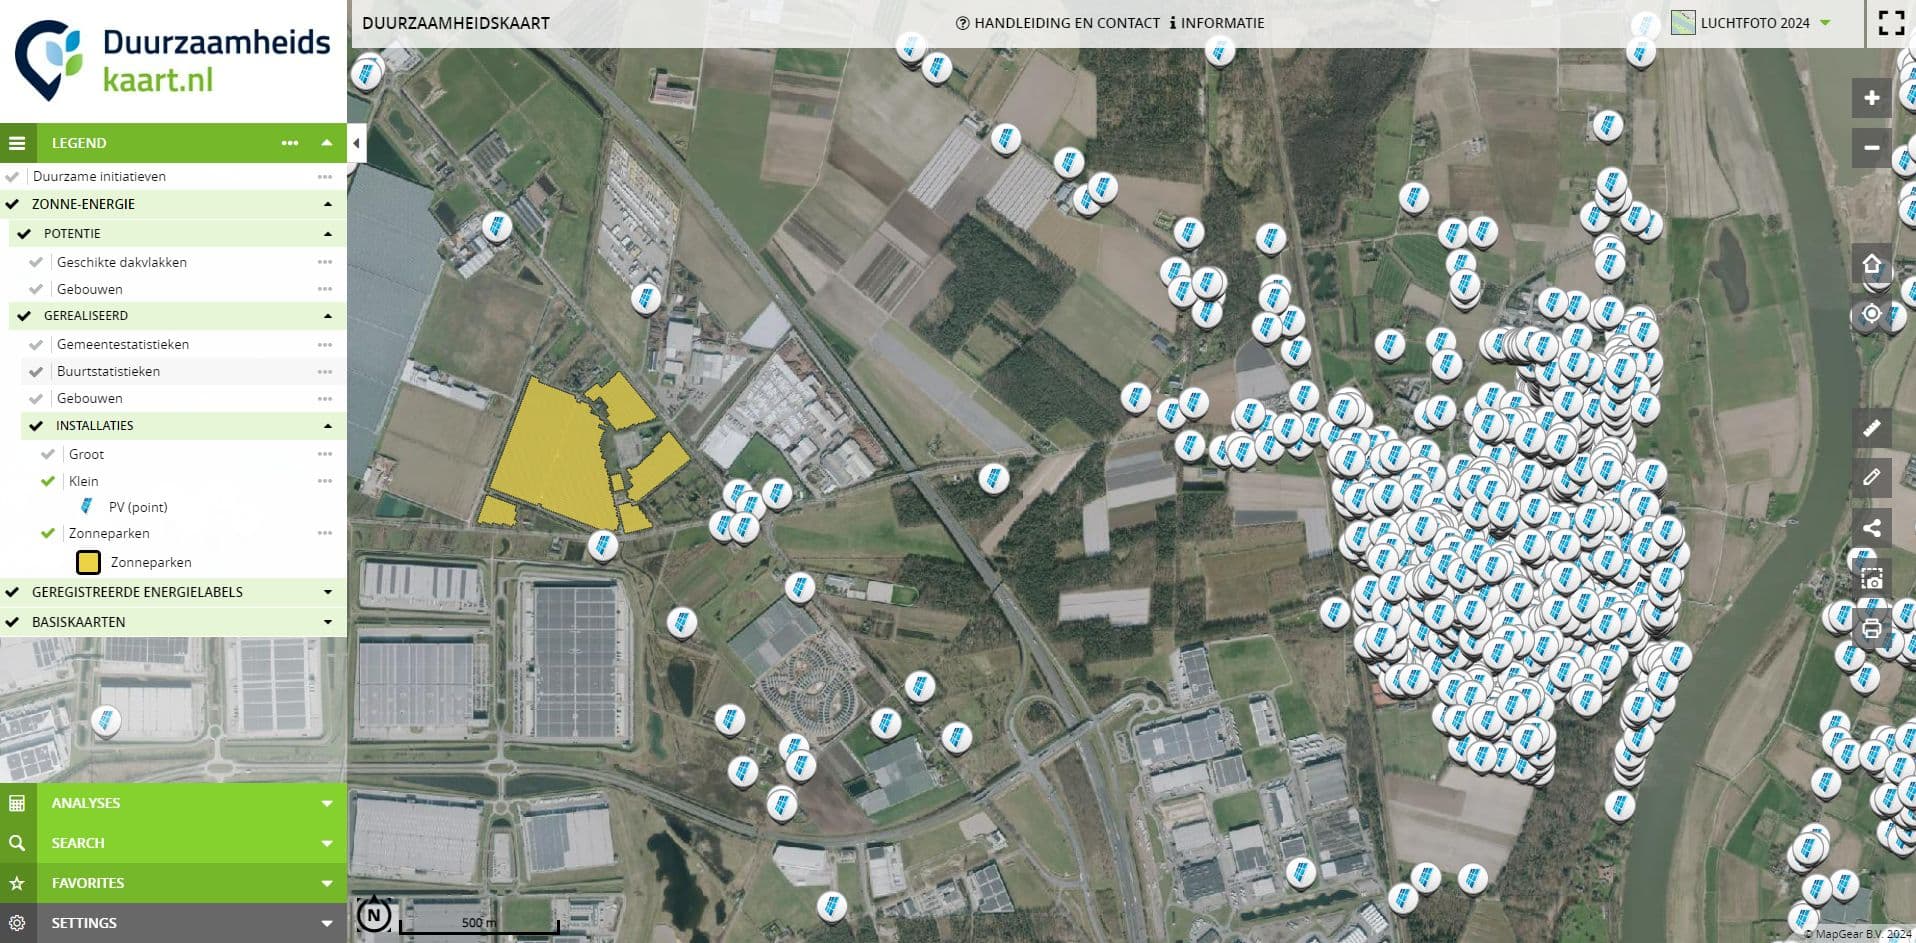
Year-on-year detection is linked to each building, allowing you to track changes in installed solar panels for every roof. These changes are also reflected in dashboards and reports, giving you insight beyond the map.
| PV - 2026 | 6 panelen |
|---|---|
| PV - 2025 | 6 panelen |
| PV - 2024 | 6 panelen |
| PV - 2023 | 6 panelen |
| PV - 2022 | 0 panelen |
| PV - 2021 | 0 panelen |
| PV - 2020 | 0 panelen |
 Aerial photo 2026
PV (Small)
Buildings
Base map
PV (Large)
Grid
For provinces and energy regions, detections are processed systematically using a grid. Each cell moves from open to in production and completed, enabling annual solar panel detection to scale across large areas while maintaining consistent quality.
Municipalities and provinces use a single detection layer for interactive maps, analysis and reporting. Compare neighbourhoods, districts or custom selections at municipal, provincial or RES level.
Click a building, filter by neighbourhood or district, or draw a custom area. View year-on-year figures and trends directly in the viewer, linked to individual buildings and administrative boundaries.
The same detection data is available in solar monitoring dashboards, KPIs and PDF reports. Compare areas, track RES targets and support decision-making with up-to-date solar deployment data.
From neighbourhoods and municipalities to provinces and national grids, the detection data scales with your needs. Provinces and RES regions monitor larger areas, while municipalities can focus on districts and neighbourhoods.
A transparent workflow from source imagery to ready-to-use map layers for municipalities, provinces, grid operators and advisors.
Current aerial imagery forms the foundation. Roofs and solar panels are detected automatically and then verified for quality.
Machine learning enables large-scale detection, while expert review helps maintain consistent quality and reliability.
Delivered as a web service, GIS files, or ready-to-use layers in ESG Maps and Solar Insight Pro.
Combine solar panel detections with roof potential, monitoring data and public-facing residential insights. Add Heat Insight, Green Insight and other sustainability layers to support integrated analysis.
Installed panels and capacity per roof.
Suitability and remaining potential per address.
Public-facing layer for awareness and guidance.
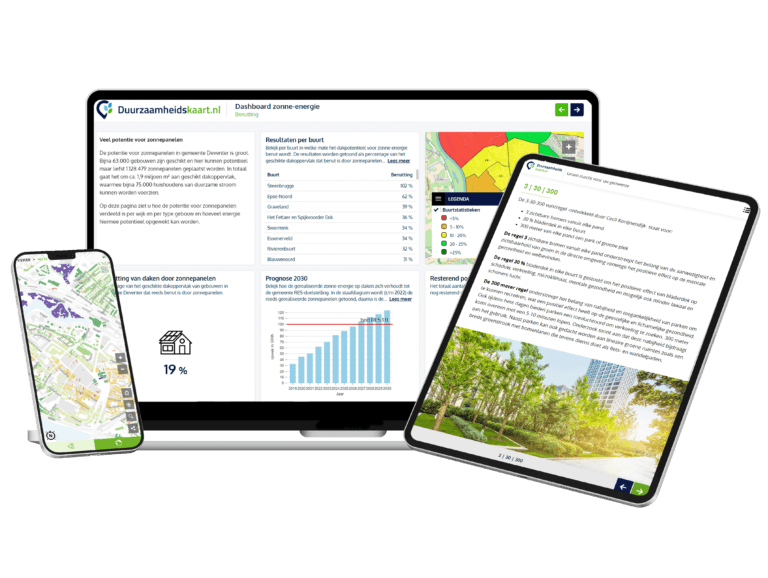
Combine map layers in your viewer or portal
Once detection is complete, choose your next step: a public solar map for residents, or Solar Insight Pro for policy, dashboards and RES reporting. Both are based on the same underlying data.
For municipalities and provinces: solar monitoring, dashboards, area analysis and RES reporting.
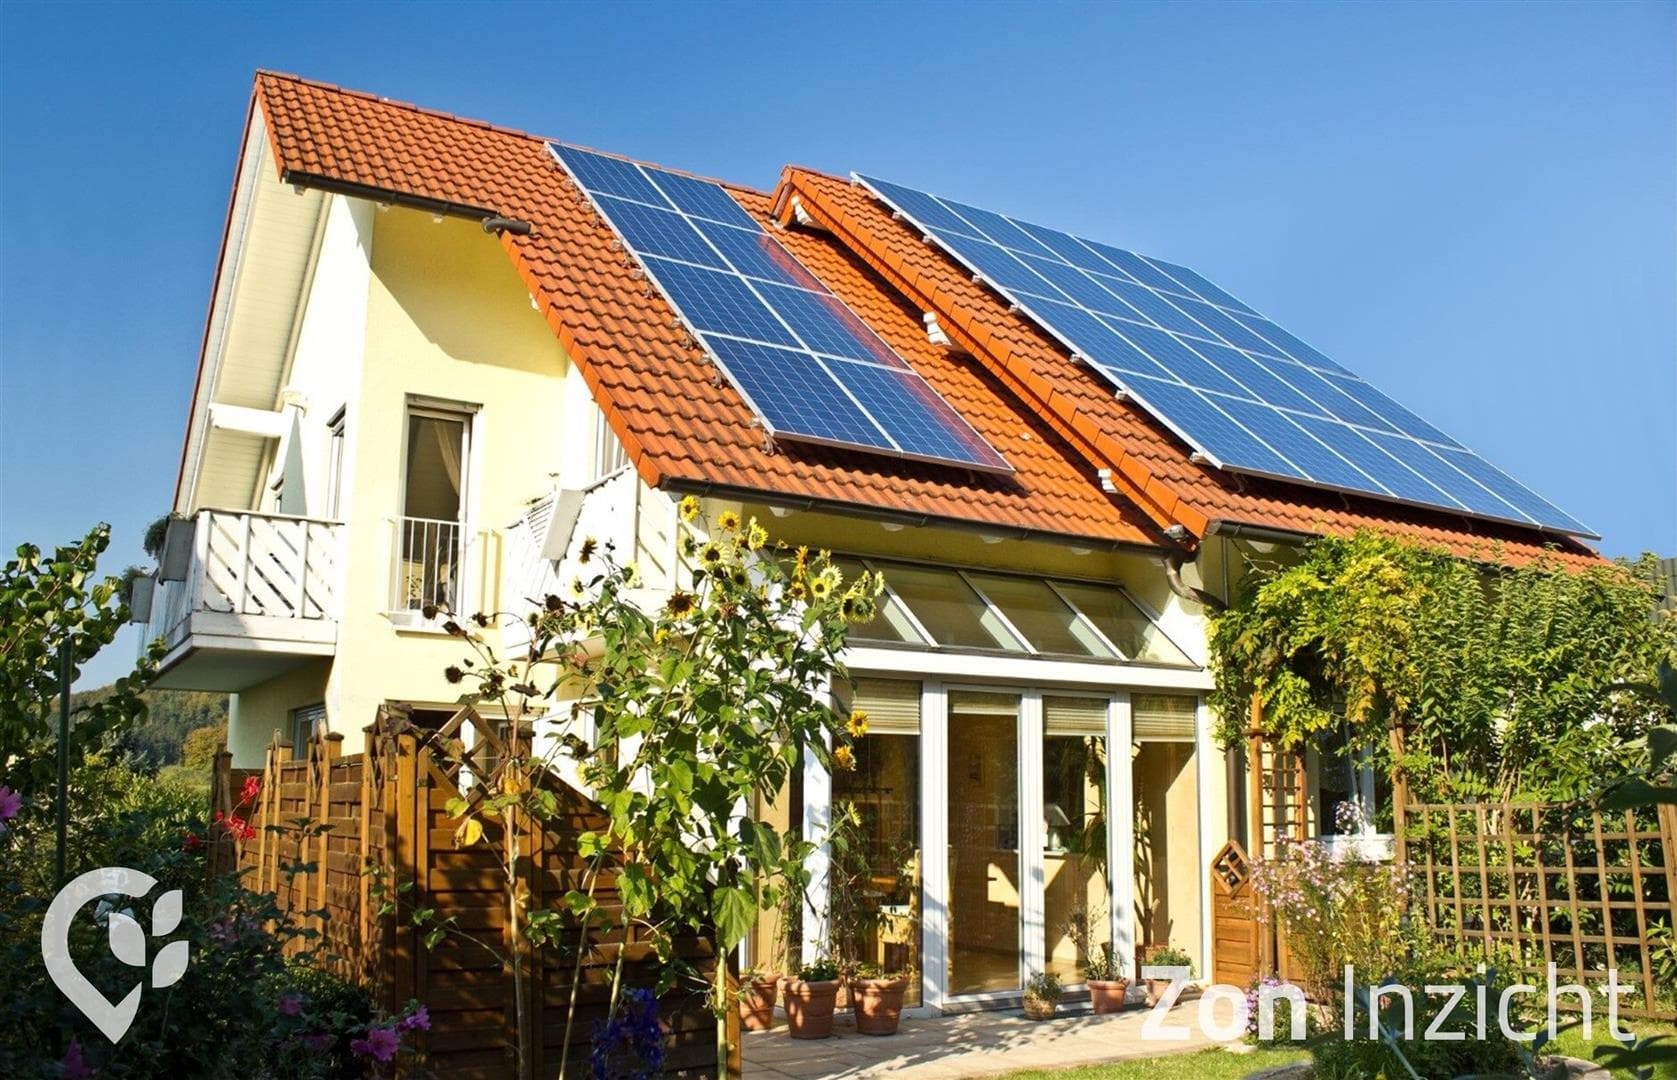
A public solar map where residents can check whether their roof is suitable for solar panels and see the estimated solar yield.
All solar solutions in one place.
Combine solar panel detection with other ESG Maps data, such as heat, green space and insulation, to support better sustainability decisions.
Practice example · Alphen aan den Rijn
Alphen aan den Rijn chose ESG Maps so solar panel detections sit in a structural monitoring instrument — year-on-year, at building and neighbourhood level. Provinces use the same method at grid scale.
Read the Alphen caseA Dutch municipality using detections as structural monitoring
01 / 02
What is already on the roof
Annual detection shows installed panels per building, not a one-off study.
Current page
Solar panel detection is part of the ESG Maps platform and can be combined with Heat Insight, Green Insight, Heat Stress Insight and other modules. One source for maps, analysis and reporting.
Solar panel detection
Experiences from organisations working with ESG Maps.
“Together with MapGear (ESG-Maps) we built a realistic solar potential forecast for Groningen in 2035 - combining data on roofs, heat pumps, electric driving and policy choices.”
“Developers invest a lot in greening, but it was hard to see what that actually delivered overall. With the new analysis we could draw up a concrete green balance for the first time.”

“Calculations that used to take us a week are now done in minutes. That saves us a huge amount of time and money.”
“We present our expertise as interactive map applications, not dry reports. Colleagues without technical knowledge can use them too - ESG-Maps is an essential foundation for policy-making.”
“ESG-Maps has helped us make sustainability data accessible to everyone. The platform combines powerful visualisation with an easy user experience.”

“Together with MapGear (ESG-Maps) we developed the TransitiePlanner for energy, climate adaptation and mobility. We are building a dynamic dossier for sustainable business parks.”

“ESG-Maps has helped us plan and deliver our energy transition projects more efficiently.”
“With Asbestdakenkaart we finally have an overview of our asbestos data and remediation progress. One place to prioritise, monitor and report.”
“Together with MapGear (ESG-Maps) we built a realistic solar potential forecast for Groningen in 2035 - combining data on roofs, heat pumps, electric driving and policy choices.”
“Developers invest a lot in greening, but it was hard to see what that actually delivered overall. With the new analysis we could draw up a concrete green balance for the first time.”
“Calculations that used to take us a week are now done in minutes. That saves us a huge amount of time and money.”
“We present our expertise as interactive map applications, not dry reports. Colleagues without technical knowledge can use them too - ESG-Maps is an essential foundation for policy-making.”
“ESG-Maps has helped us make sustainability data accessible to everyone. The platform combines powerful visualisation with an easy user experience.”
“Together with MapGear (ESG-Maps) we developed the TransitiePlanner for energy, climate adaptation and mobility. We are building a dynamic dossier for sustainable business parks.”
“ESG-Maps has helped us plan and deliver our energy transition projects more efficiently.”
“With Asbestdakenkaart we finally have an overview of our asbestos data and remediation progress. One place to prioritise, monitor and report.”
Request a demo or quote for solar panel detection, annual updates and GIS integration.
Answers about detections, accuracy and delivery.
Combining AI and manual review we typically achieve at least 95% accuracy, depending on aerial image quality.
We follow annual aerial cycles so you can report year-on-year progress.
Yes — export as WMS/WFS, GIS files or layers in ESG Maps and Solar Insight Pro. Combine with other modules such as Heat Insight for heat from water or Green Insight for multicriteria analysis.
Yes. The same detections appear on the map (per building, neighbourhood or selection) and in solar monitor dashboards and reports — for comparing neighbourhoods, districts and custom areas.
Choose your next step: Solar Insight Pro for policy and dashboards, or the public solar map for residents. Both are based on the same underlying detection and potential data.
Contact
Questions about our products? Looking for a demo or quote? Fill in the form and we will get back to you.
Fill out the form and we will contact you within 24 hours, or book .