“Developers invest a lot in greening, but it was hard to see what that actually delivered overall. With the new analysis we could draw up a concrete green balance for the first time.”
Developers invest a lot in greening, but it was hard to see what that actually delivered overall. With the new analysis we could draw up a concrete green balance for the first time.
Mark Hoksberg
Urban ecologist, Municipality of Hengelo
Trusted by municipalities, provinces and organisations in the Netherlands and Belgium




















































Green Insight on ESG Maps brings tree registers, aerial imagery and satellite-based canopy data into one map. Terramira (formerly NEO) detects trees and crowns, including crown area and volume, so a mature tree is not treated the same as a newly planted one.
A city-wide percentage hides neighbourhood differences. Combine green with heat, paving and development plans to see where greening adds the most value, and where loss is happening.
Nature Restoration Regulation duties sit with member states, but municipalities feel the impact in neighbourhoods. You need a consistent spatial picture of what is actually changing, not only what was planted.
Measurable
Green area & canopy
Spatial
Where it changes
Baseline
Reference year 2024
Policy
Prioritise measures
2024
National reference year for urban green
2026
Draft national restoration plan due
2030
No net loss of urban green and canopy
The same picture supports Nature Restoration Regulation monitoring, climate adaptation and liveability. Measure again over time so you see whether measures actually land.
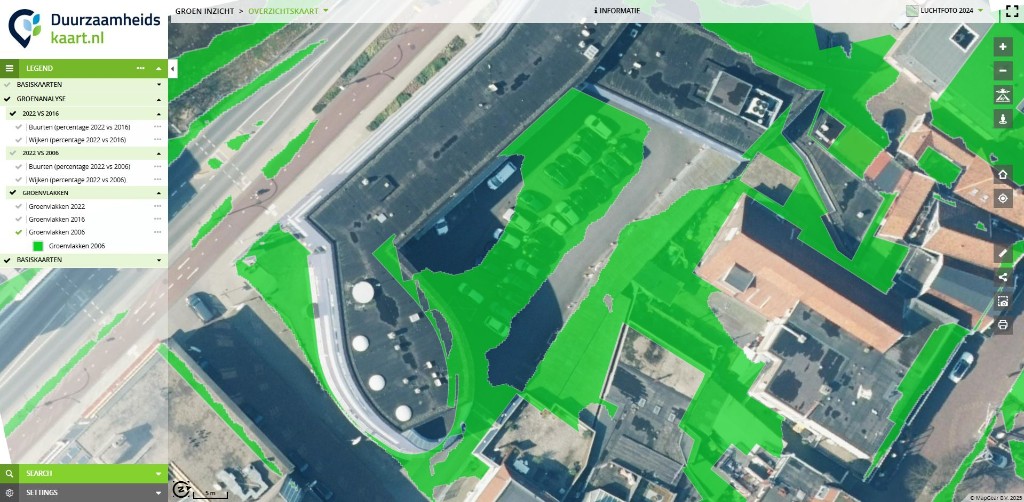
Green cover versus a later aerial — the kind of change you track between survey years
How much green there is, and whether the total is growing or shrinking versus a 2024-style baseline.
A core Nature Restoration Regulation indicator, measured per neighbourhood and between survey years.
Go beyond tree counts: crown area and volume show the value of mature versus young trees.
See where greening adds cooling, where loss is likely, and where to plant or protect first.
Practice example · Hengelo
Until recently nobody knew how much green Hengelo was losing or gaining. Neighbourhood analysis made the balance visible — and usable for liveability and policy — before the Nature Restoration Regulation made this urgent.
Read the Hengelo caseHengelo already works this way
01 / 03
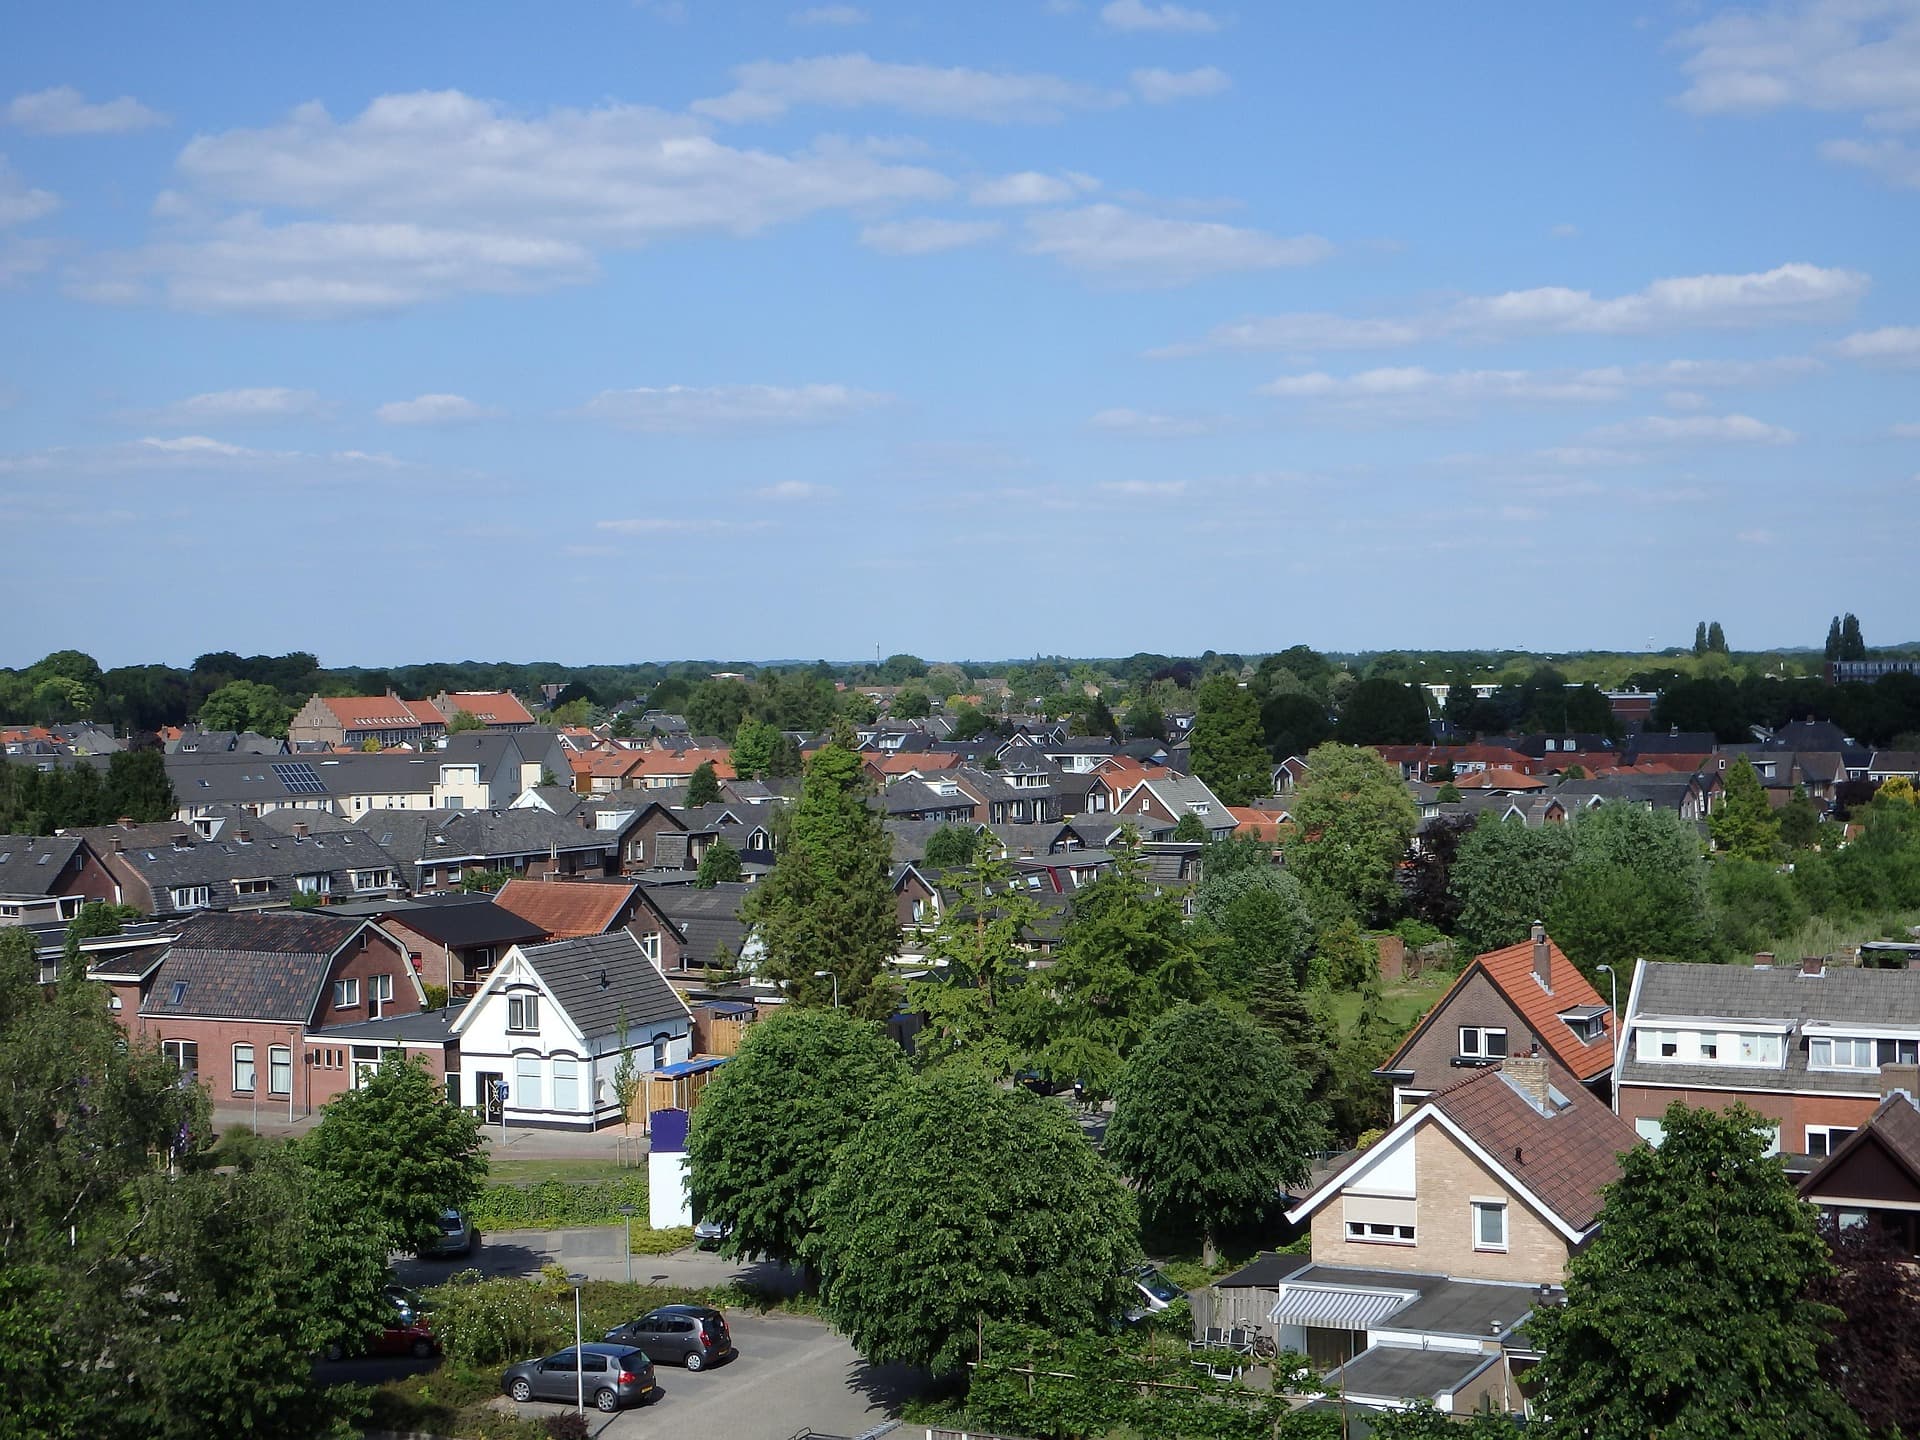
The city you can see from the street
Housing, paving and mature trees sit side by side. A city-wide percentage hides where that mix is slipping.
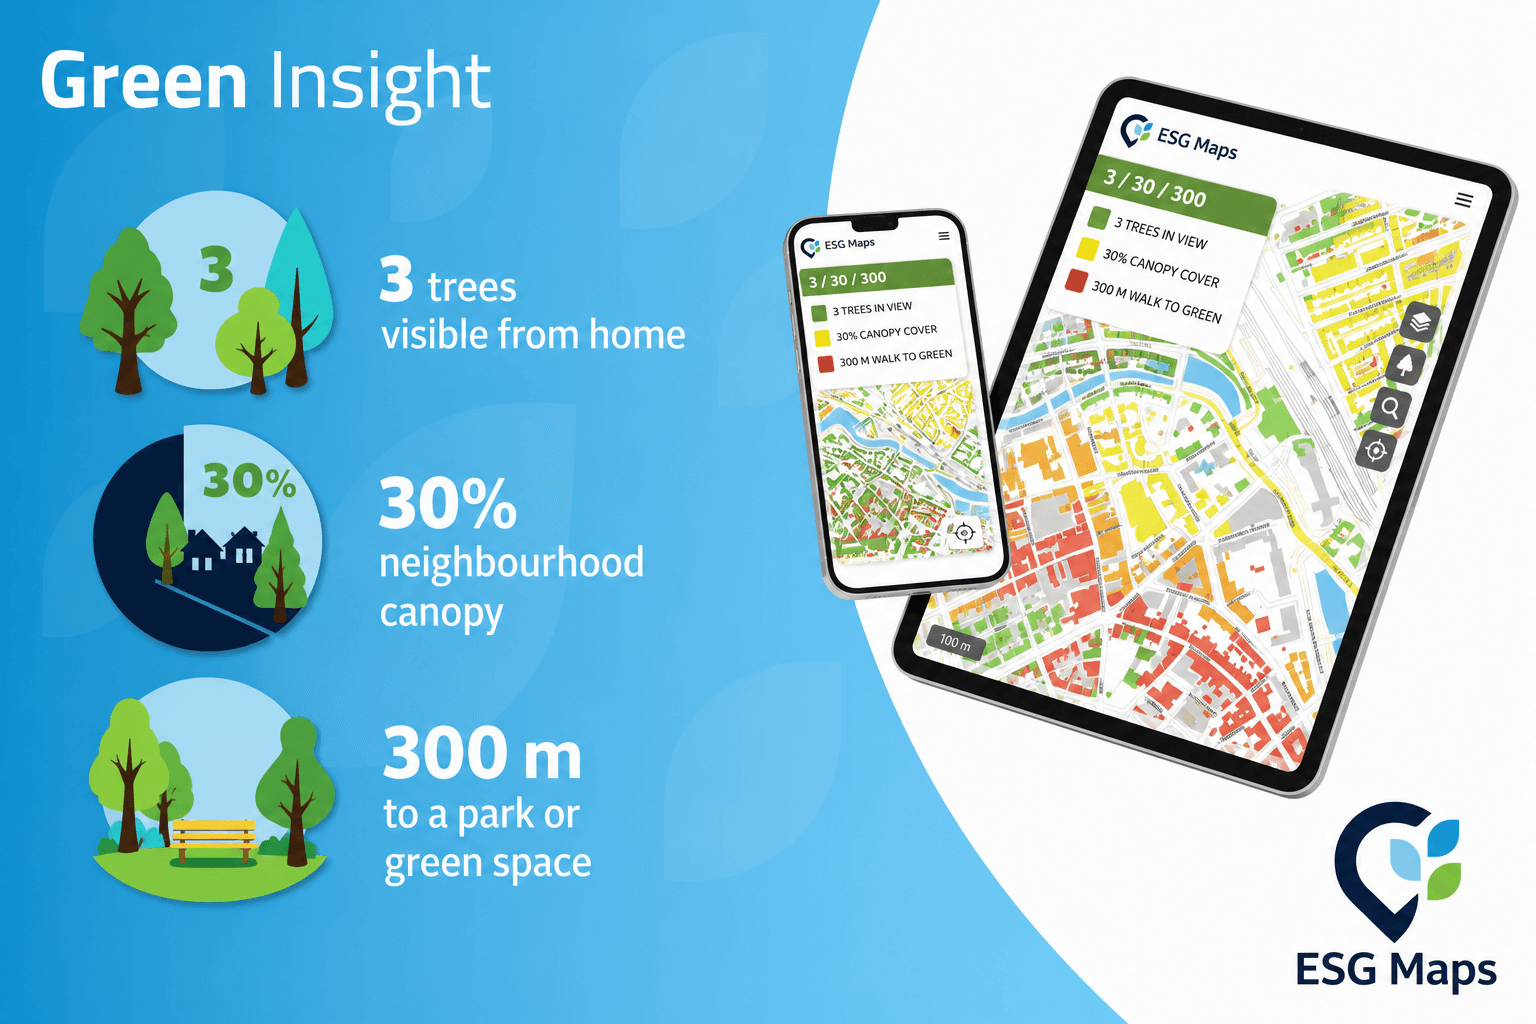
Alongside Nature Restoration Regulation indicators, 3-30-300 remains a practical liveability guideline. Green Insight shows how neighbourhoods score on all three.
“The 3-30-300 rule is an evidence-informed guideline for creating greener, healthier and more resilient neighbourhoods.”
3
Visible trees
From every point in the living environment at least 3 trees should be visible. This supports mental wellbeing.
30%
Neighbourhood canopy
In every neighbourhood at least 30% of the surface should be canopy. This supports cooling, cleaner air and urban nature.
300 m
To a park or green space
Every home should be within 300 metres of a park or green space. This supports everyday access to recreation and nature.
Current page
Green Insight sits in the ESG Maps platform with heat, climate adaptation and your other sustainability layers, so nature restoration, cooling and spatial development share one picture.
Green Insight
Experiences from organisations working with ESG Maps.
“Developers invest a lot in greening, but it was hard to see what that actually delivered overall. With the new analysis we could draw up a concrete green balance for the first time.”

“Calculations that used to take us a week are now done in minutes. That saves us a huge amount of time and money.”

“We present our expertise as interactive map applications, not dry reports. Colleagues without technical knowledge can use them too - ESG-Maps is an essential foundation for policy-making.”
“ESG-Maps has helped us make sustainability data accessible to everyone. The platform combines powerful visualisation with an easy user experience.”
“Together with MapGear (ESG-Maps) we built a realistic solar potential forecast for Groningen in 2035 - combining data on roofs, heat pumps, electric driving and policy choices.”

“Together with MapGear (ESG-Maps) we developed the TransitiePlanner for energy, climate adaptation and mobility. We are building a dynamic dossier for sustainable business parks.”

“ESG-Maps has helped us plan and deliver our energy transition projects more efficiently.”
“With Asbestdakenkaart we finally have an overview of our asbestos data and remediation progress. One place to prioritise, monitor and report.”
“Developers invest a lot in greening, but it was hard to see what that actually delivered overall. With the new analysis we could draw up a concrete green balance for the first time.”
“Calculations that used to take us a week are now done in minutes. That saves us a huge amount of time and money.”
“We present our expertise as interactive map applications, not dry reports. Colleagues without technical knowledge can use them too - ESG-Maps is an essential foundation for policy-making.”
“ESG-Maps has helped us make sustainability data accessible to everyone. The platform combines powerful visualisation with an easy user experience.”
“Together with MapGear (ESG-Maps) we built a realistic solar potential forecast for Groningen in 2035 - combining data on roofs, heat pumps, electric driving and policy choices.”
“Together with MapGear (ESG-Maps) we developed the TransitiePlanner for energy, climate adaptation and mobility. We are building a dynamic dossier for sustainable business parks.”
“ESG-Maps has helped us plan and deliver our energy transition projects more efficiently.”
“With Asbestdakenkaart we finally have an overview of our asbestos data and remediation progress. One place to prioritise, monitor and report.”
Request a demo of ESG Maps Green Insight: canopy, green area and change over time, including Terramira tree data.
Answers about urban green monitoring, the Nature Restoration Regulation and Green Insight.
Duties sit at member-state level, but local green, canopy and biodiversity data feed national monitoring. For urban ecosystems the regulation aims for no net loss of urban green and tree canopy cover by 2030 versus 2024, and an upward trend after that. Municipalities need a reliable picture of how much green they have, where it is, and how it develops.
Terramira (formerly NEO) uses aerial photos, satellite data and elevation models to detect trees and crowns, including crown area and volume. ESG Maps turns those results into maps and comparisons between survey years that policy teams can use alongside heat, paving and other layers.
At least 3 trees visible from every home, 30% canopy in every neighbourhood, and a park or green space within 300 metres. It is a liveability guideline, not a legal requirement. Green Insight can still show neighbourhood scores on these three points, next to Nature Restoration Regulation indicators such as urban green area and canopy change.
Canopy and green cover are updated on a regular cycle from current satellite and aerial imagery. That lets you follow trends and see the effect of greening or loss between survey moments.
Yes. Hengelo used data-driven green monitoring to make the green balance visible and to support liveability and policy choices. The approach is presented as a practice example on ESG Maps.
The analyses and maps can support policy plans, funding applications and the justification of greening measures.
Yes. We offer API access and export to common formats (including GeoJSON, WMS). Connections with ArcGIS, QGIS and municipal portals are possible.
Contact
Questions about our products? Looking for a demo or quote? Fill in the form and we will get back to you.
Fill out the form and we will contact you within 24 hours, or book .