
Choose your product(s)
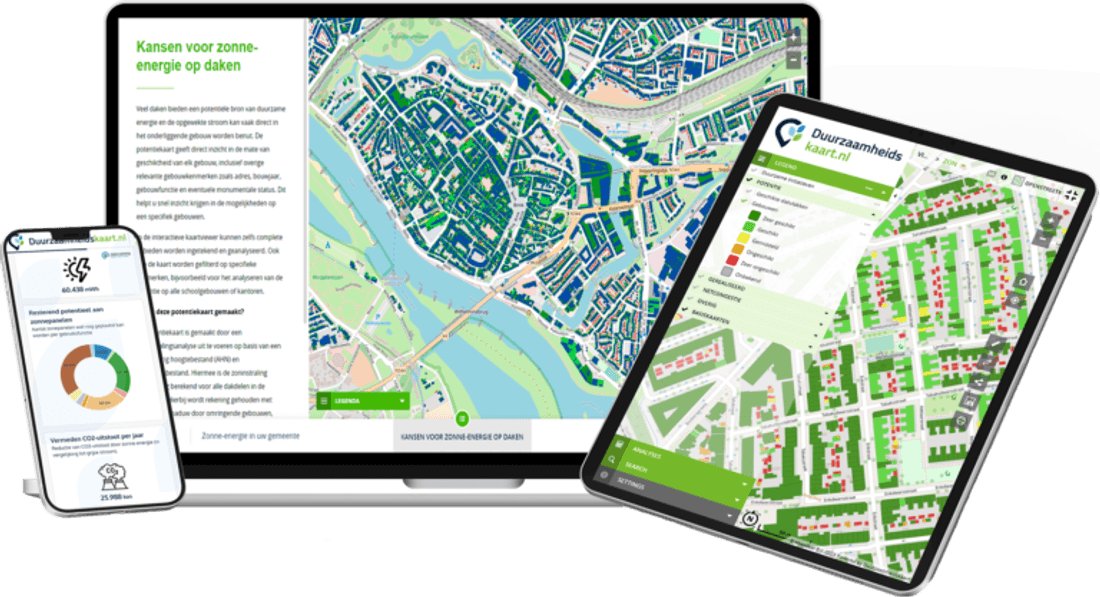
Each product includes valuable insights we refresh annually, in an easy-to-share map for analysis, and in a clear interactive report. Extras such as dashboards for trends are available too.
GIS for sustainability
The platform that helps organisations make energy, climate and livability visible — and discussable with stakeholders.
Using our solutions
Specialist data solutions
Cloud-based access
Current data and updates
Trusted by municipalities, provinces and organisations in the Netherlands and Belgium



















































Your sustainability data stays current and easy to access.

Everything clearly organised in a single platform.

Advanced tools for deeper insight and monitoring.

An intuitive interface for every user.

Automated reports for efficient communication with stakeholders.
ESG Maps products align with current societal themes in the public realm. We currently offer valuable insights in the following areas:
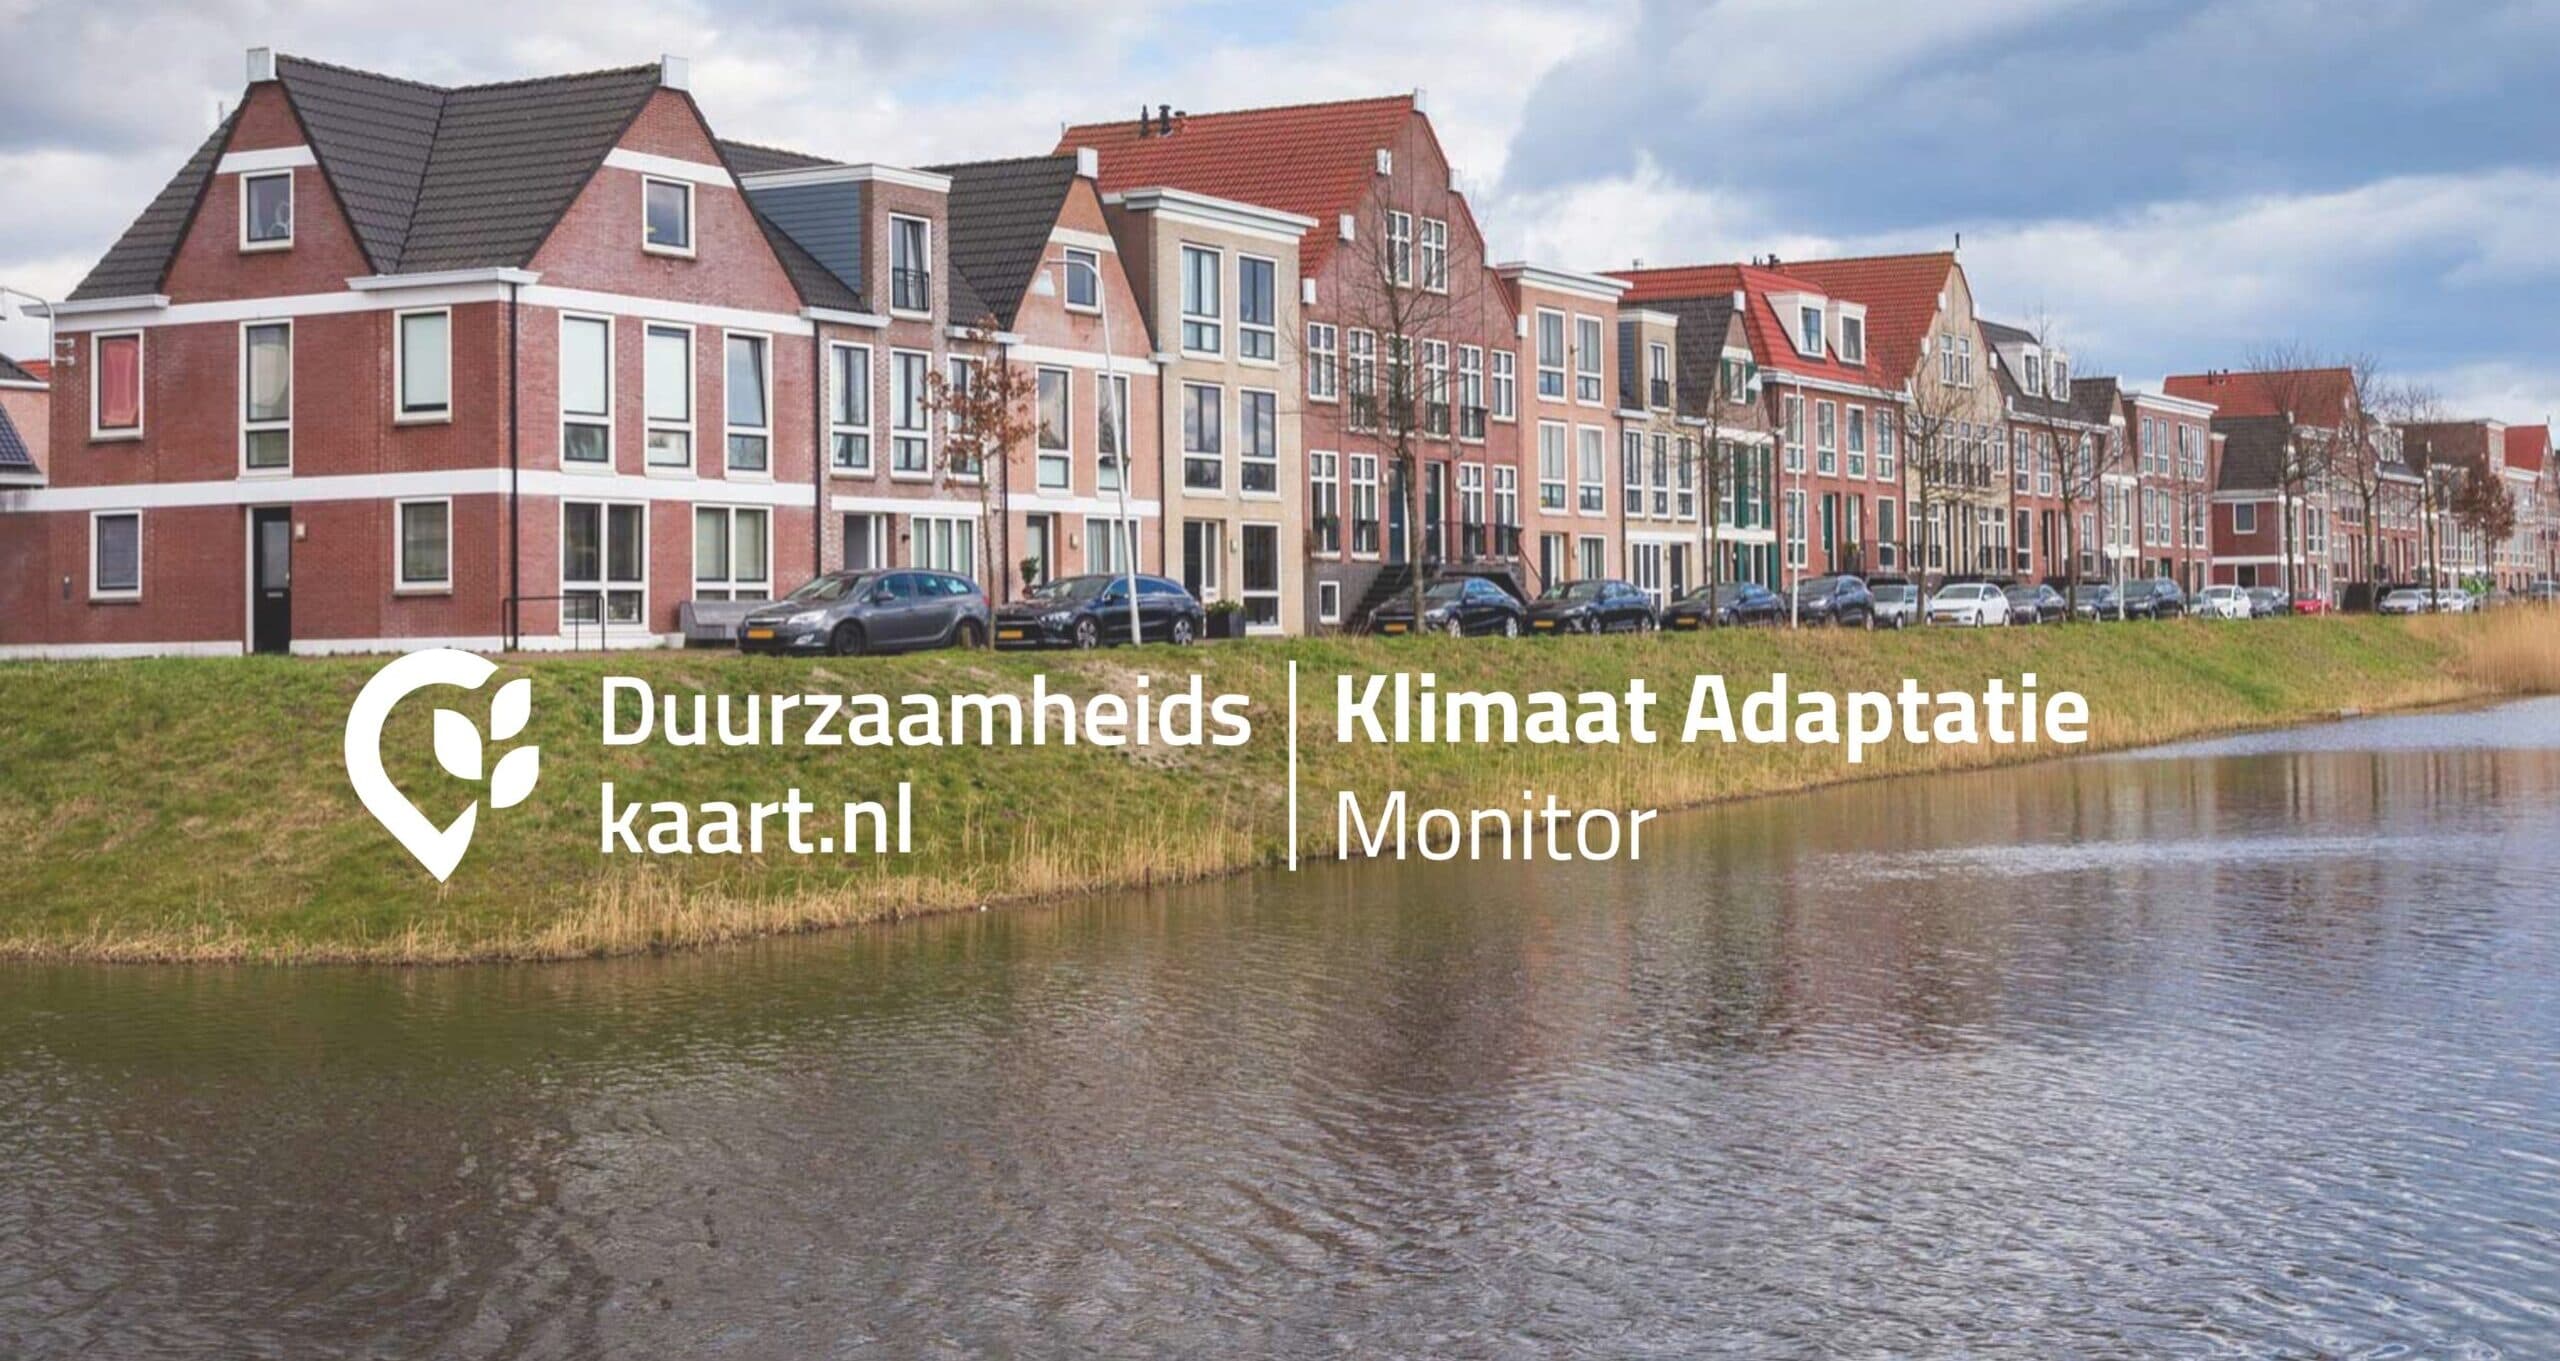
Monitor heat, drought and flood risk for effective climate adaptation.
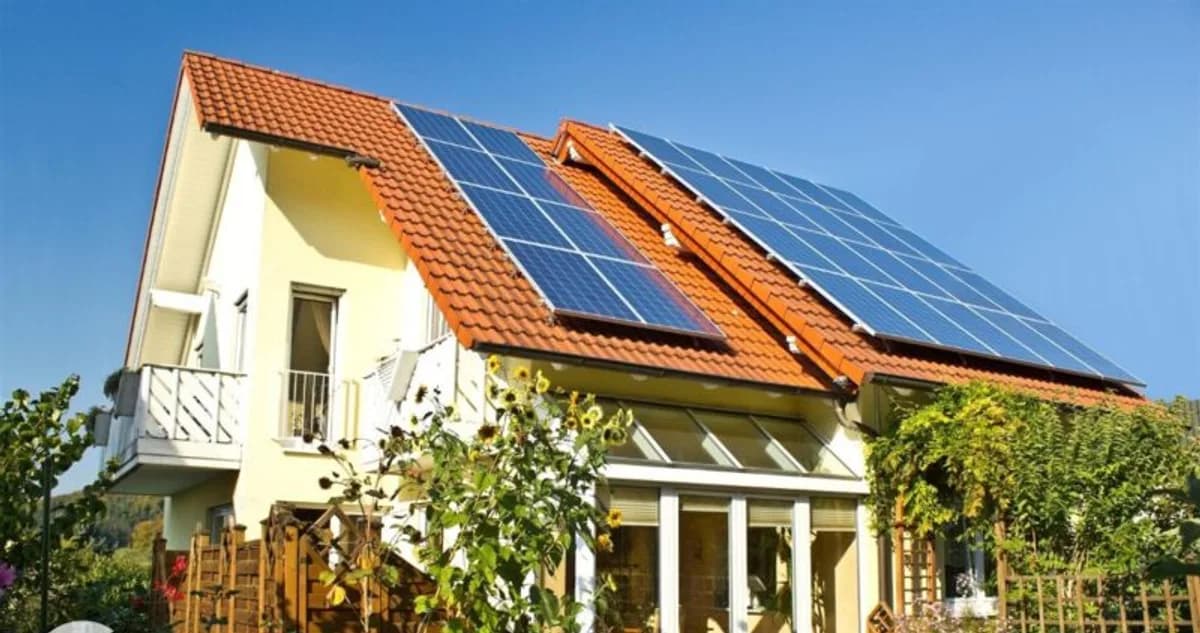
Solar map for residents and Solar Map Pro for policy: potential and monitoring.
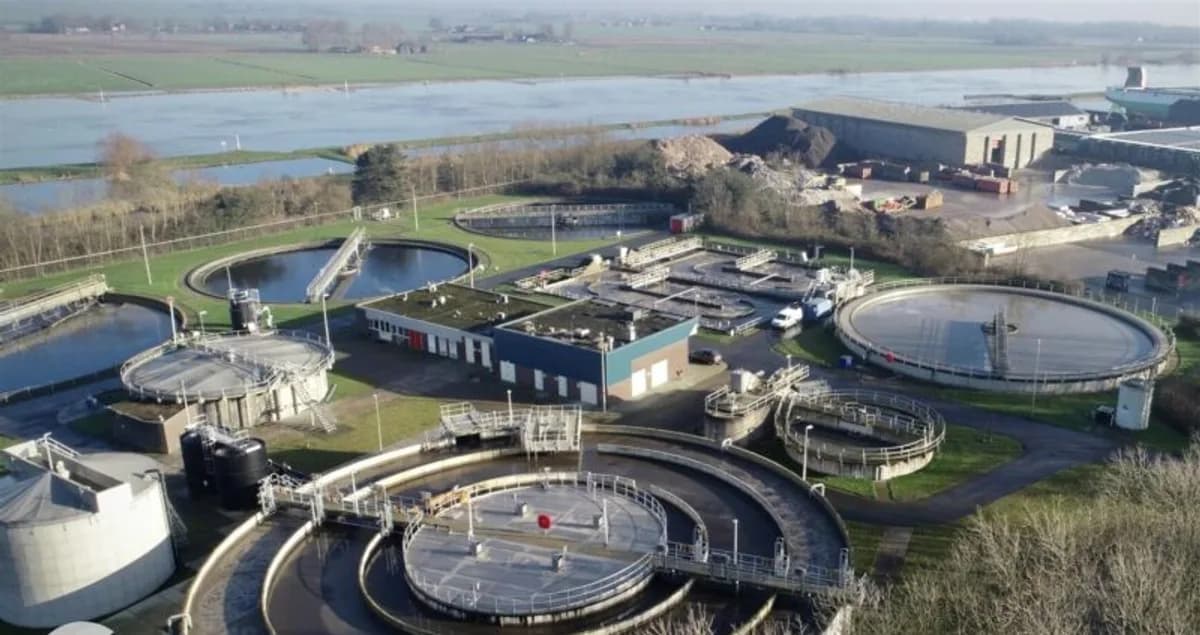
Analyse sustainable heat sources and plan gas-free district heating.

Reduce heat stress with cool-spot planning and shade measures.
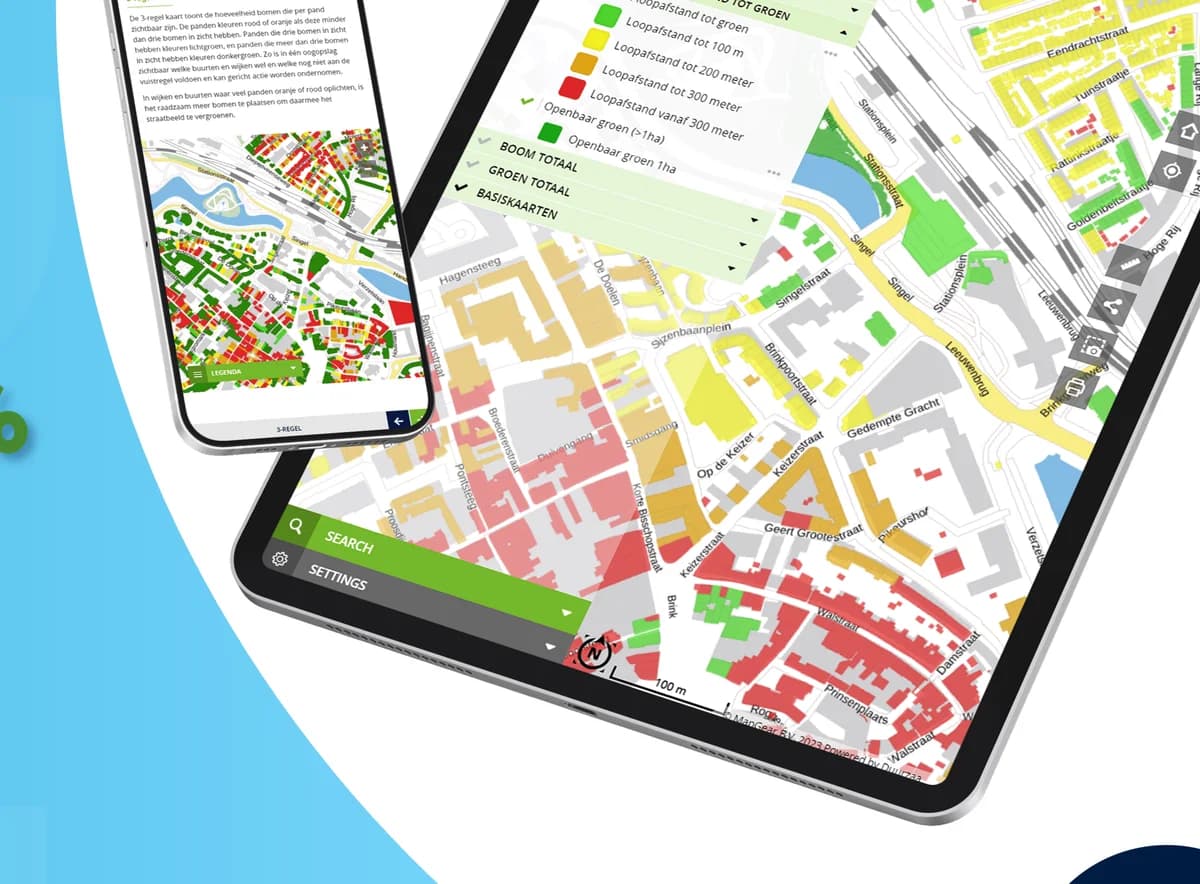
Monitor urban green and canopy cover for the Nature Restoration Regulation, liveability and climate adaptation.
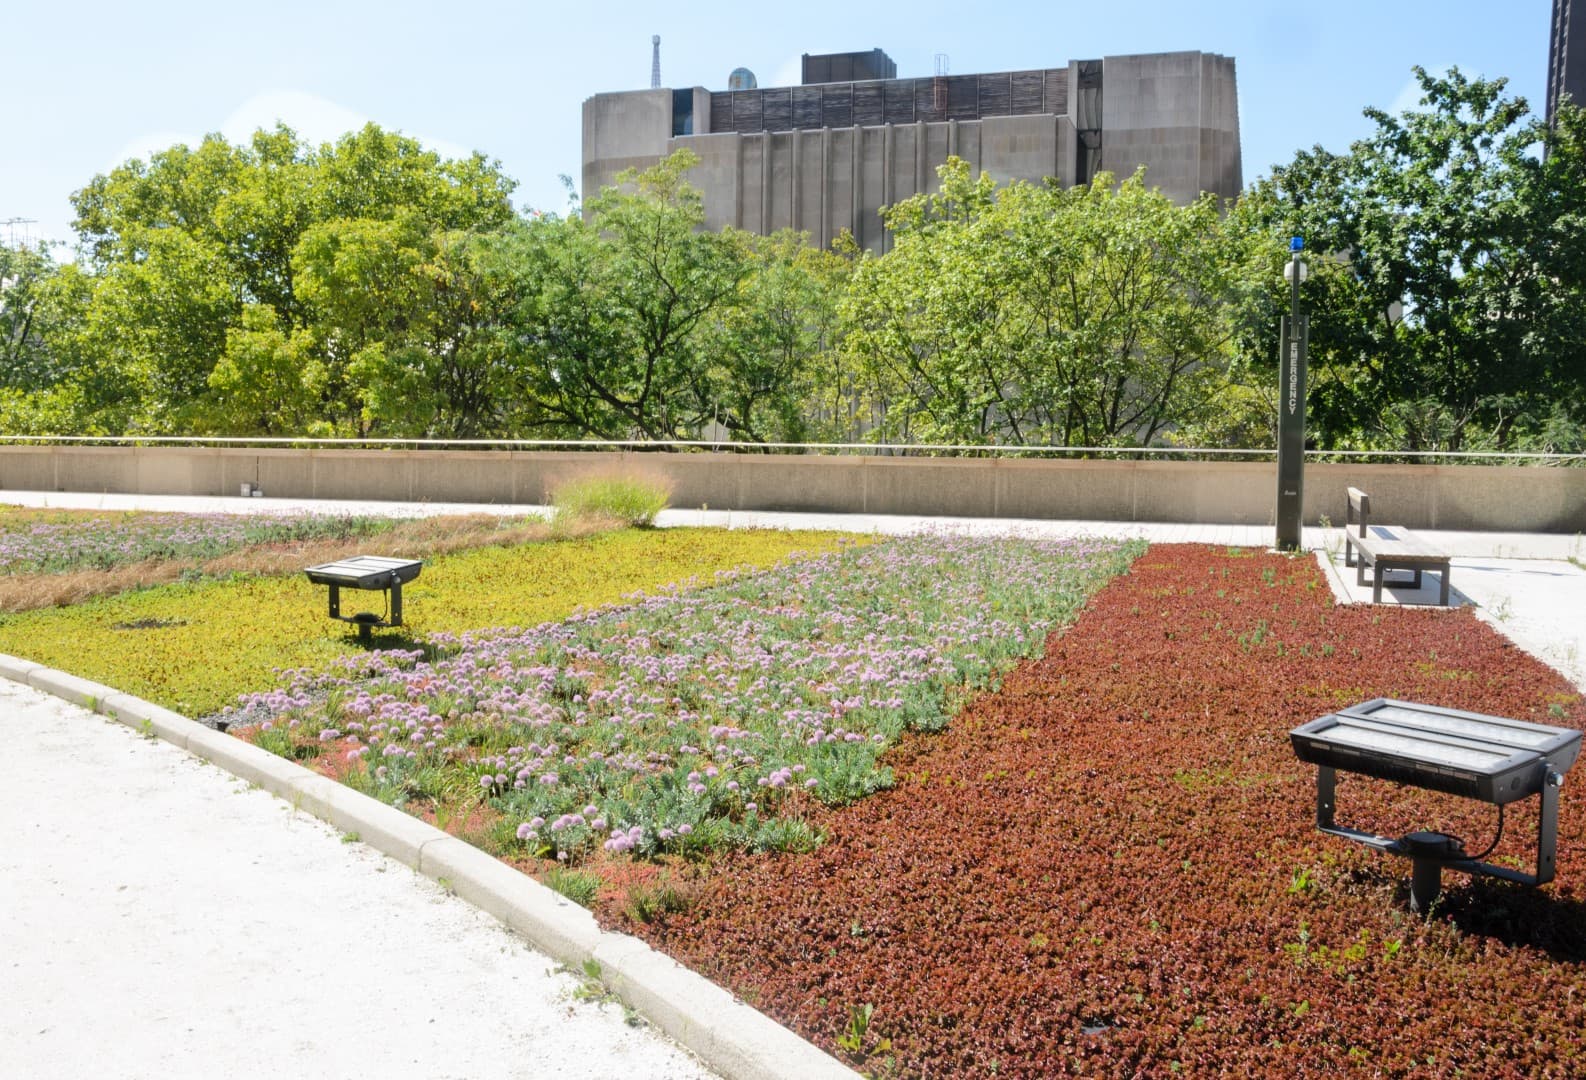
Assess green-roof potential and whether your roof is suitable.
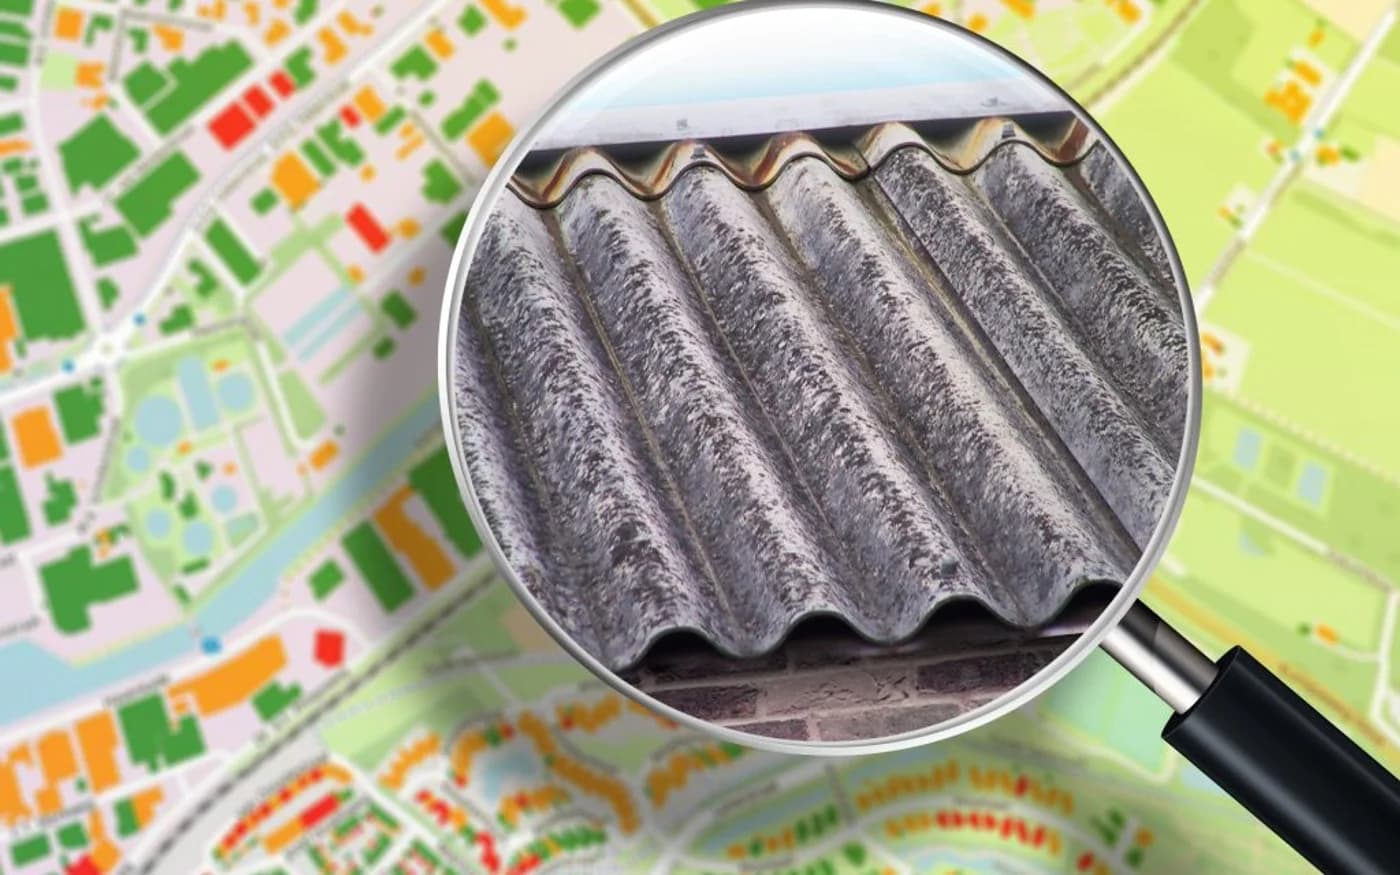
Inventory asbestos roofs and coordinate sustainable renovation.
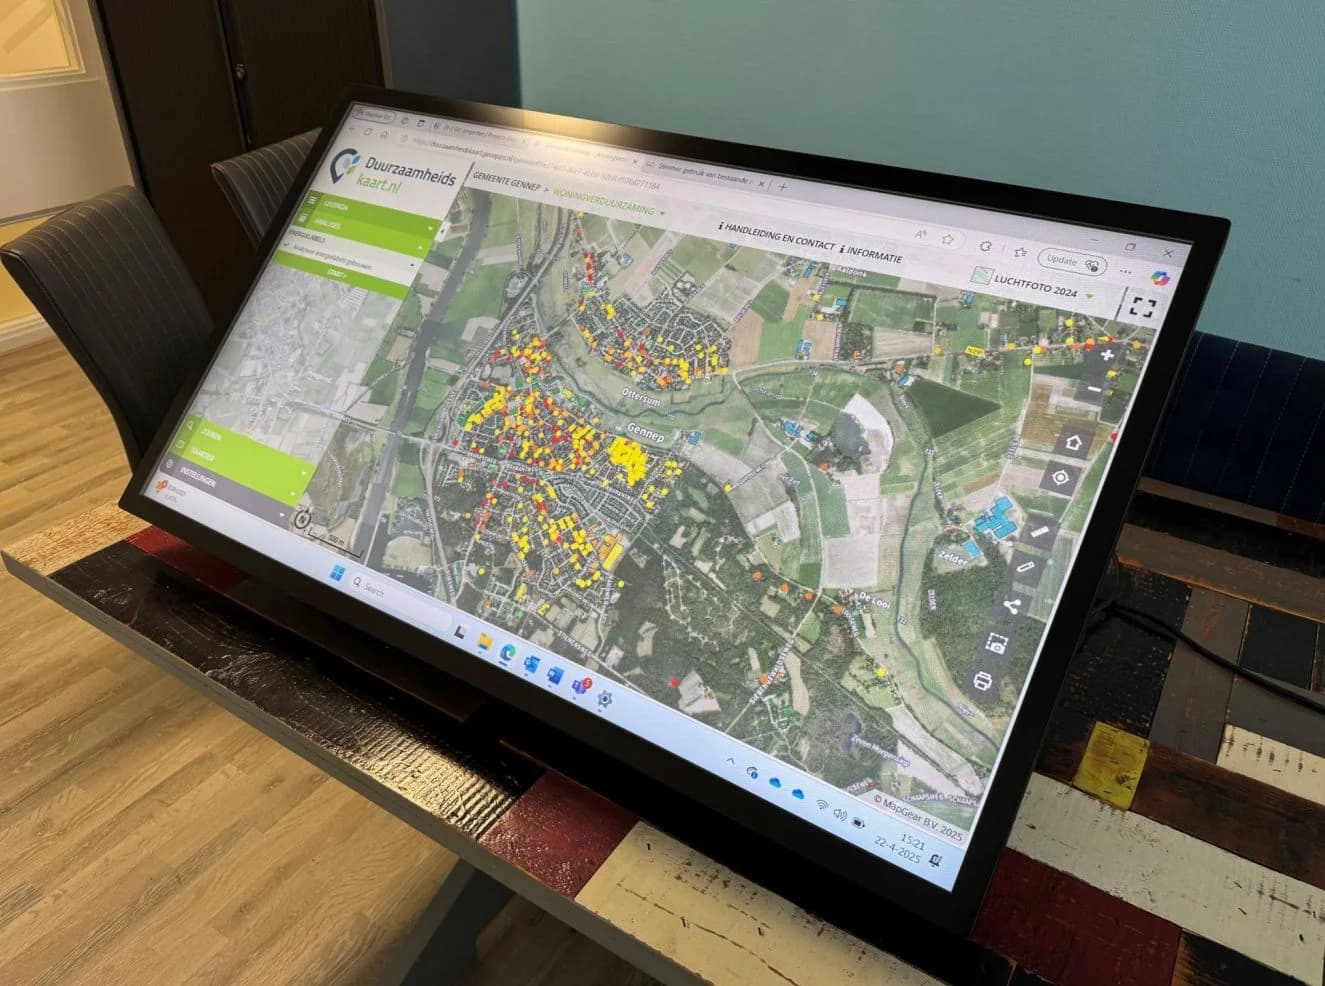
Map protected species for nature-friendly construction projects.
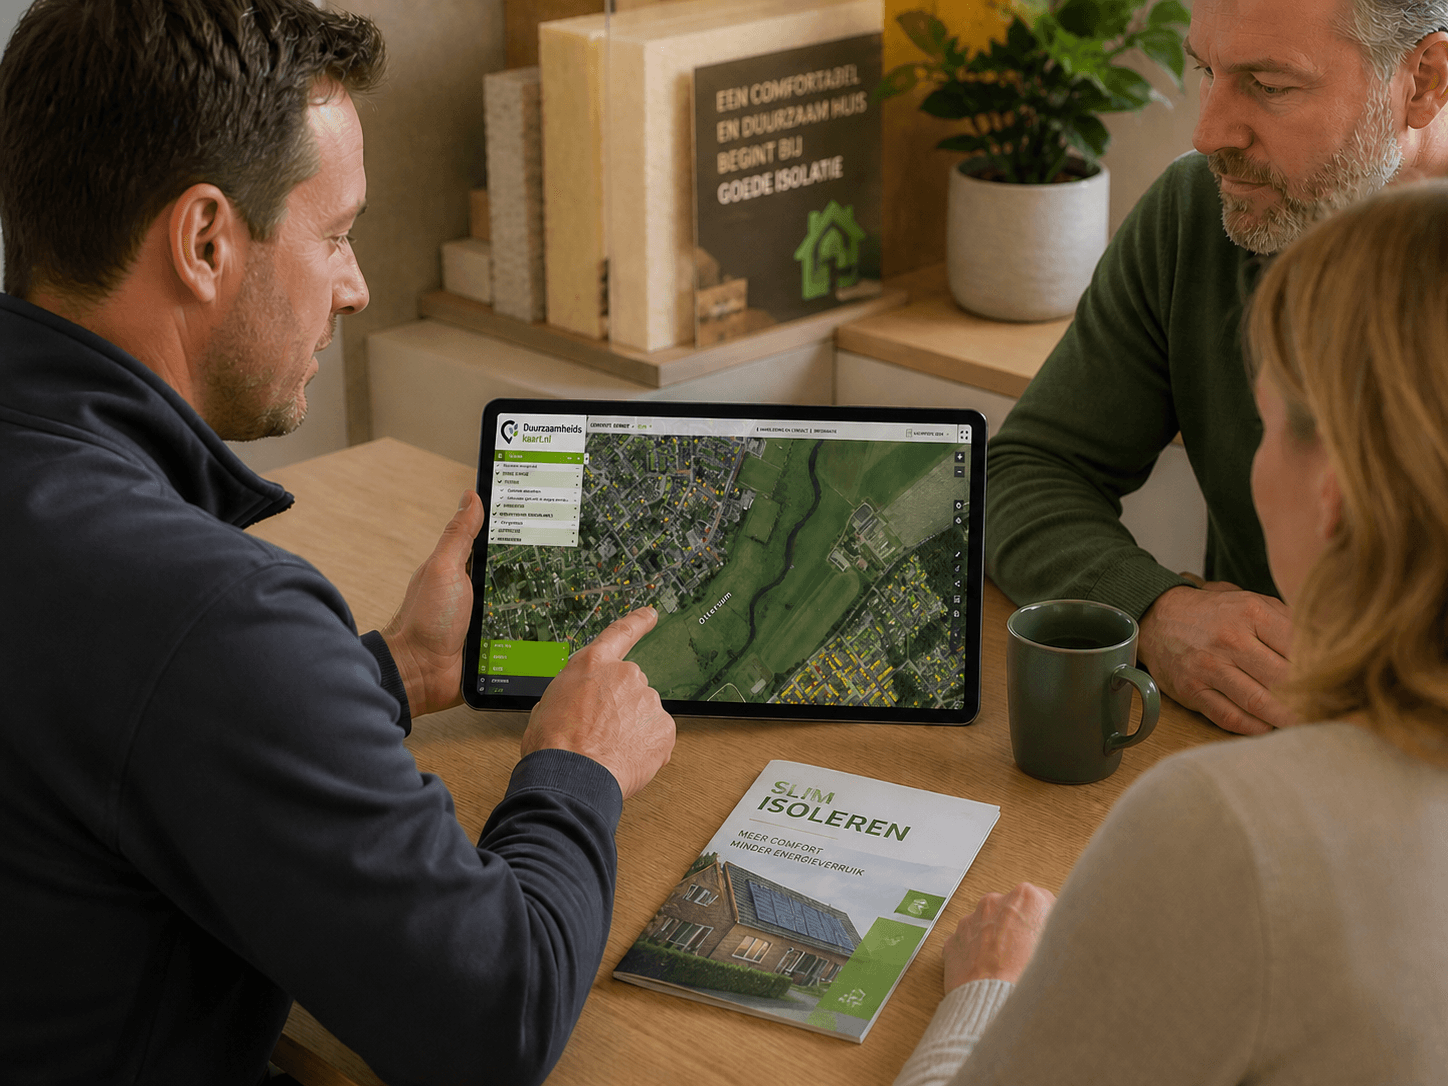
Analyse energy-saving potential of homes for effective insulation.
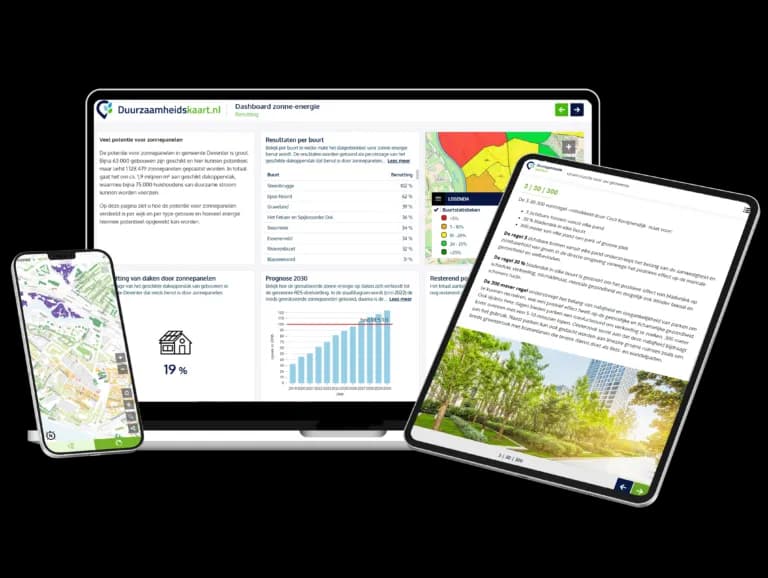
DICE (collective energy projects service): from grid congestion to collective action on business parks.
Full overview including integrations, GeoApps, TouchTable and more.
Powerful tools and features for sustainability data visualization and monitoring
Visualize complex sustainability data on understandable maps. Zoom in, filter and analyze data at different scale levels.
Monitor progress and performance with real-time dashboards. Generate automatic reports for stakeholders and management.
Engage residents in sustainability projects with public tools and participation platforms. Make data accessible and discussable.
Your data is secure with enterprise-grade security. Regular backups and updates ensure reliable availability.
Start with ESG Maps within a few weeks. Our team ensures quick configuration and seamless integration.
Grows with your organization. Add new products and features when you need them.
From product choice to go-live in three steps.
Each product includes valuable insights we refresh annually, in an easy-to-share map for analysis, and in a clear interactive report. Extras such as dashboards for trends are available too.

Tell us which products or services interest you. Use the contact form to request a no-obligation demo or a tailored quote, we will get back to you as soon as we can.

You receive access to a secure online environment with all your products in one place. We guide your onboarding so you can get started effectively, and support is there when you need it.
Experiences from organisations working with ESG Maps.
“Developers invest a lot in greening, but it was hard to see what that actually delivered overall. With the new analysis we could draw up a concrete green balance for the first time.”

“Calculations that used to take us a week are now done in minutes. That saves us a huge amount of time and money.”

“We present our expertise as interactive map applications, not dry reports. Colleagues without technical knowledge can use them too - ESG-Maps is an essential foundation for policy-making.”
“ESG-Maps has helped us make sustainability data accessible to everyone. The platform combines powerful visualisation with an easy user experience.”
“Together with MapGear (ESG-Maps) we built a realistic solar potential forecast for Groningen in 2035 - combining data on roofs, heat pumps, electric driving and policy choices.”

“Together with MapGear (ESG-Maps) we developed the TransitiePlanner for energy, climate adaptation and mobility. We are building a dynamic dossier for sustainable business parks.”

“ESG-Maps has helped us plan and deliver our energy transition projects more efficiently.”
“With Asbestdakenkaart we finally have an overview of our asbestos data and remediation progress. One place to prioritise, monitor and report.”
“Developers invest a lot in greening, but it was hard to see what that actually delivered overall. With the new analysis we could draw up a concrete green balance for the first time.”
“Calculations that used to take us a week are now done in minutes. That saves us a huge amount of time and money.”
“We present our expertise as interactive map applications, not dry reports. Colleagues without technical knowledge can use them too - ESG-Maps is an essential foundation for policy-making.”
“ESG-Maps has helped us make sustainability data accessible to everyone. The platform combines powerful visualisation with an easy user experience.”
“Together with MapGear (ESG-Maps) we built a realistic solar potential forecast for Groningen in 2035 - combining data on roofs, heat pumps, electric driving and policy choices.”
“Together with MapGear (ESG-Maps) we developed the TransitiePlanner for energy, climate adaptation and mobility. We are building a dynamic dossier for sustainable business parks.”
“ESG-Maps has helped us plan and deliver our energy transition projects more efficiently.”
“With Asbestdakenkaart we finally have an overview of our asbestos data and remediation progress. One place to prioritise, monitor and report.”
Find quick answers to the most common questions about ESG Maps
You request a demo or conversation; we’ll discuss with you whether there’s a good fit. Depending on your situation, we can show examples from other municipalities or provinces, or arrange temporary access to data from a neighbouring authority that already uses ESG Maps. It depends on your timeline and data availability; we’re happy to work through the options with you.
ESG Maps integrates data from various sources such as aerial photos, BAG data, climate models and energy data. You can also upload your own data for integrated analyses. We can also perform solar panel detections or other analyses for you, or create, analyze or report on data, with our GIS team and experts from our partner network.
Yes. Training focuses on using the platform as a viewer: your team learns to use the low-touch analysis tools without needing to be an expert in data or GIS. Because we build on a GIS platform, we can also support GIS-related use. We also run workshops with the Duurzaamheidstafel for participation and presentation.
Yes. You can upload your own GIS data, spreadsheets and other sources, or connect via web services (e.g. WMS, WFS or API). We’re happy to advise which approach is most effective for your situation (one-off upload, periodic sync or live connection via web services) so you get the most efficient setup. Our team helps configure and secure the integration.
We often create setups for annual or bi-annual data and analyses. You then get access to the viewer with maps per theme and analysis tools. Pricing depends on the number of users, what you want to share, and which themes and updates you need. Contact us for a tailored quote.
Contact
Questions about our products? Looking for a demo or quote? Fill in the form and we will get back to you.
Fill out the form and we will contact you within 24 hours, or book .