Samenwerking Syntraal: van data naar duurzame keuzes | Duurzaamheidskaart
Veel gemeenten hebben data, maar missen samenhang. Ontdek hoe samenwerking met Syntraal leidt tot beter inzicht en uitvoerbare duurzaamheidskeuzes.
Read moreVeel gemeenten hebben data, maar missen samenhang. Ontdek hoe samenwerking met Syntraal leidt tot beter inzicht en uitvoerbare duurzaamheidskeuzes.
Read more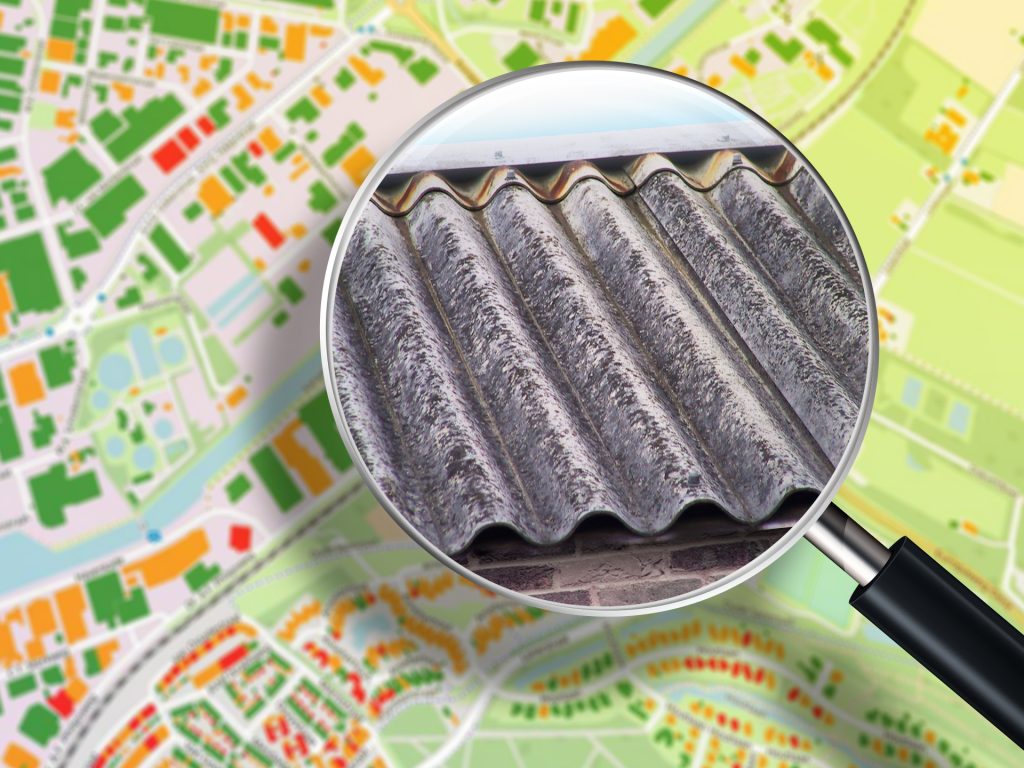
Een asbestdakenkaart kan technisch sterk zijn, maar zonder slimme updates loopt data achter. Ontdek hoe Drenthe vertraging en extra vragen voorkomt.
Read more
Alphen aan den Rijn start een vierjarige zonpaneelmonitoring met AI-gestuurde detectie en gemeentelijke dashboards voor structurele beleidssturing.
Read more
Hoe krijg je grip op stedelijk groen? In Hengelo maakt een data-analyse trends inzichtelijk en helpt gemeenten sturen op leefbaarheid en beleid.
Read more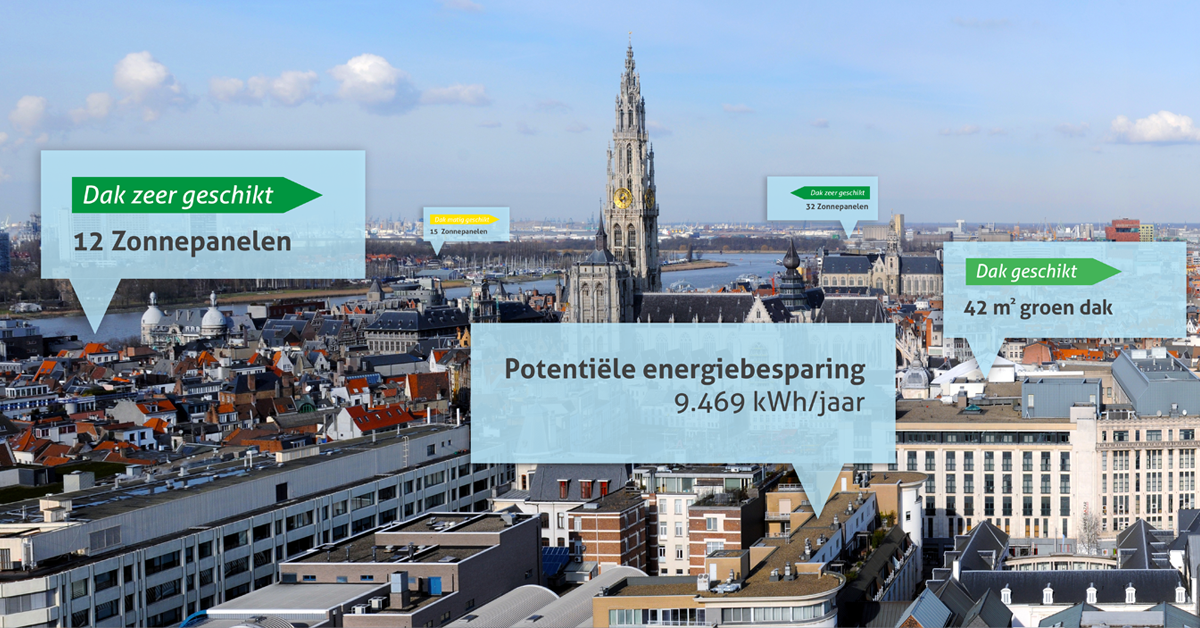
De Duurzaamheidskaart in de praktijk Al ruim 210.000 Antwerpenaren bekeken de potentie van hun dak: wat is het rendement van zonnepanelen? En hoe goed isoleert...
Read more
‘Is mijn woning eigenlijk geschikt voor zonnepanelen?’ Het antwoord op die vraag zien inwoners van de gemeente Leiden binnenkort in de online Duurzaamheidskaart. MapGear gaat...
Read more
Want to know what we can do for your organisation? Contact us for a no-obligation demo. Special requirements? No problem - leave your details below.