“Calculations that used to take us a week are now done in minutes. That saves us a huge amount of time and money.”
Heat from water & heat transition
Heat Insight links heat from water (TEO, TEA and TED) to heat demand per neighbourhood. You see where sources are relevant, which factors affect how promising they are, and where further study is worthwhile.
More information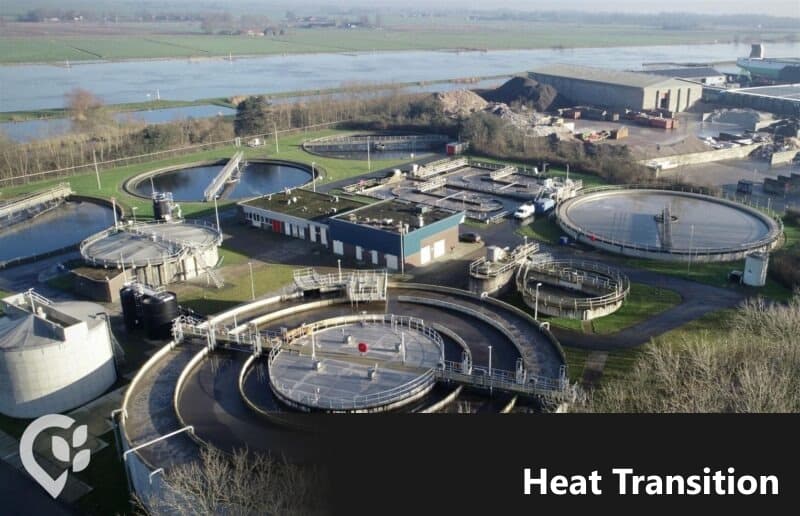
Calculations that used to take us a week are now done in minutes. That saves us a huge amount of time and money.
Harry de Brauw
Energy transition advisor
Trusted by municipalities, provinces and organisations in the Netherlands and Belgium









































Heat from water uses thermal energy from surface water (TEO), wastewater (TEA) and drinking water (TED). A national potential map shows where heat is technically available. Policy needs the next question: where does that heat meet the built environment, and under which conditions does it stay promising?
Heat Insight brings sources, neighbourhood demand, distance, networks and scenarios together. Select a district and see whether heat from water deserves a first shortlist — before you develop an area vision or heat-transition plan.
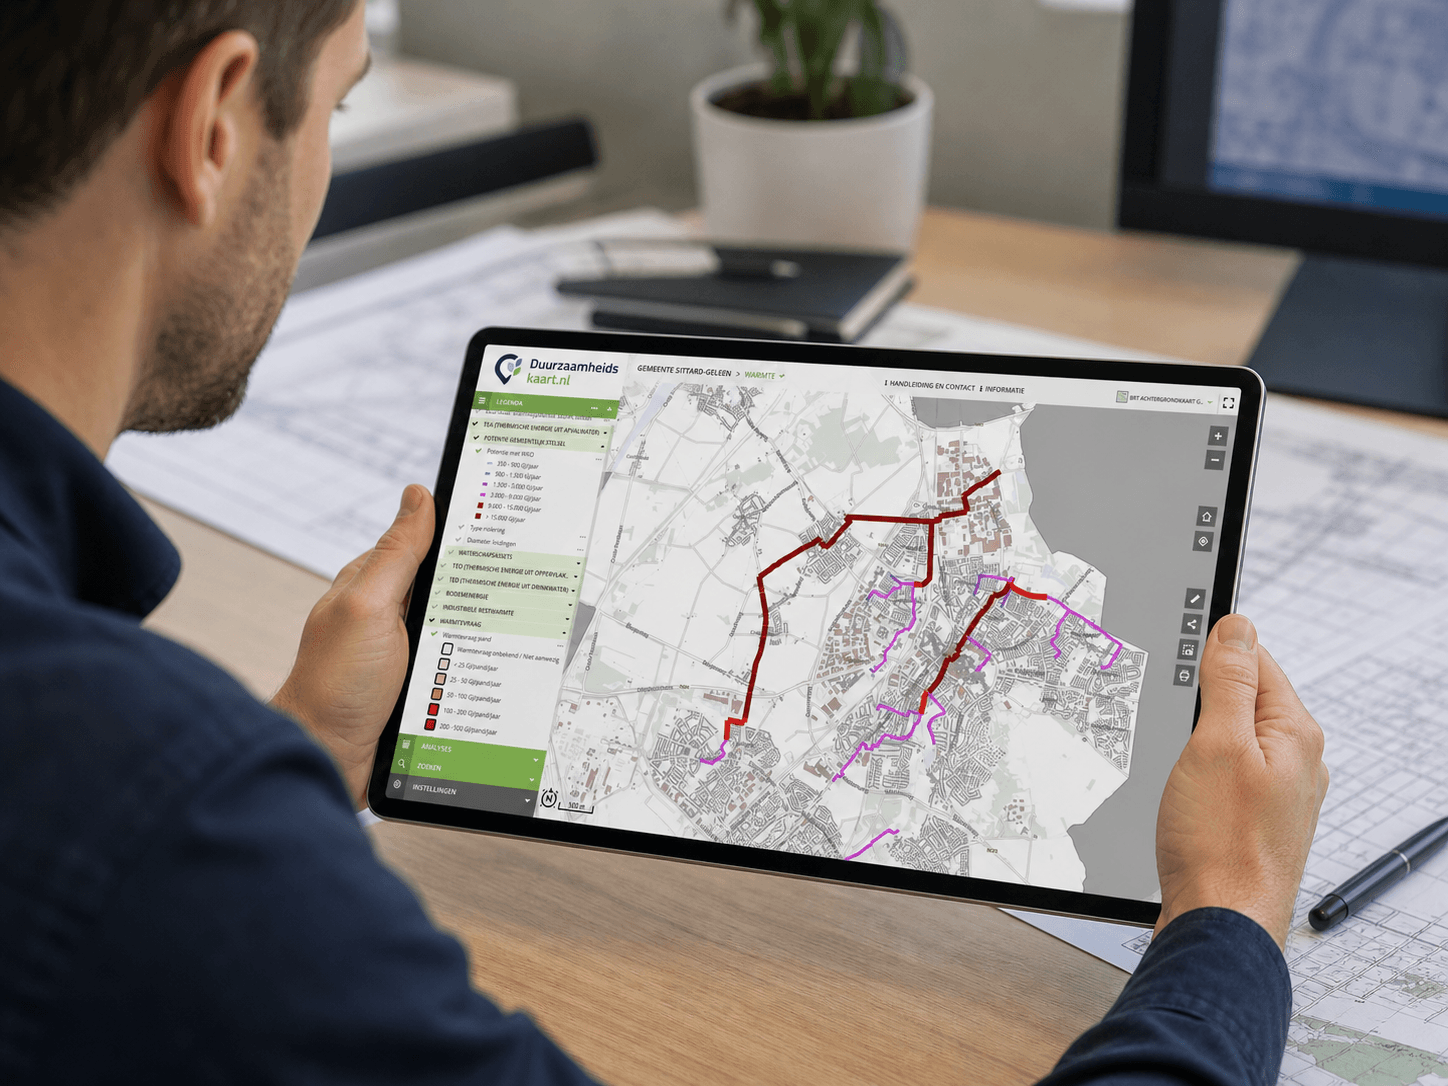
The WarmingUP example (not Heat Insight itself) shows how heat from water is built in layers: orient first, then go deeper. Heat Insight follows the same logic in ESG Maps, next to your other municipal data.
TEO
Surface water
TEA
Wastewater
TED
Drinking water
Demand
Per neighbourhood
Scan
Quickscan: where technical potential is relevant for neighbourhoods
2021
Deepening: feasibility, extraction regimes and sensitivity as map layers
Vision
Area analysis and area vision as input for the heat-transition plan
The WarmingUP MapTour explains the viewer as: quickscan for a first selection, deepening for the factors, area analysis for scenarios. That is not a one-off report, but a repeatable process for regional energy strategy, heat-transition plans and local trade-offs.
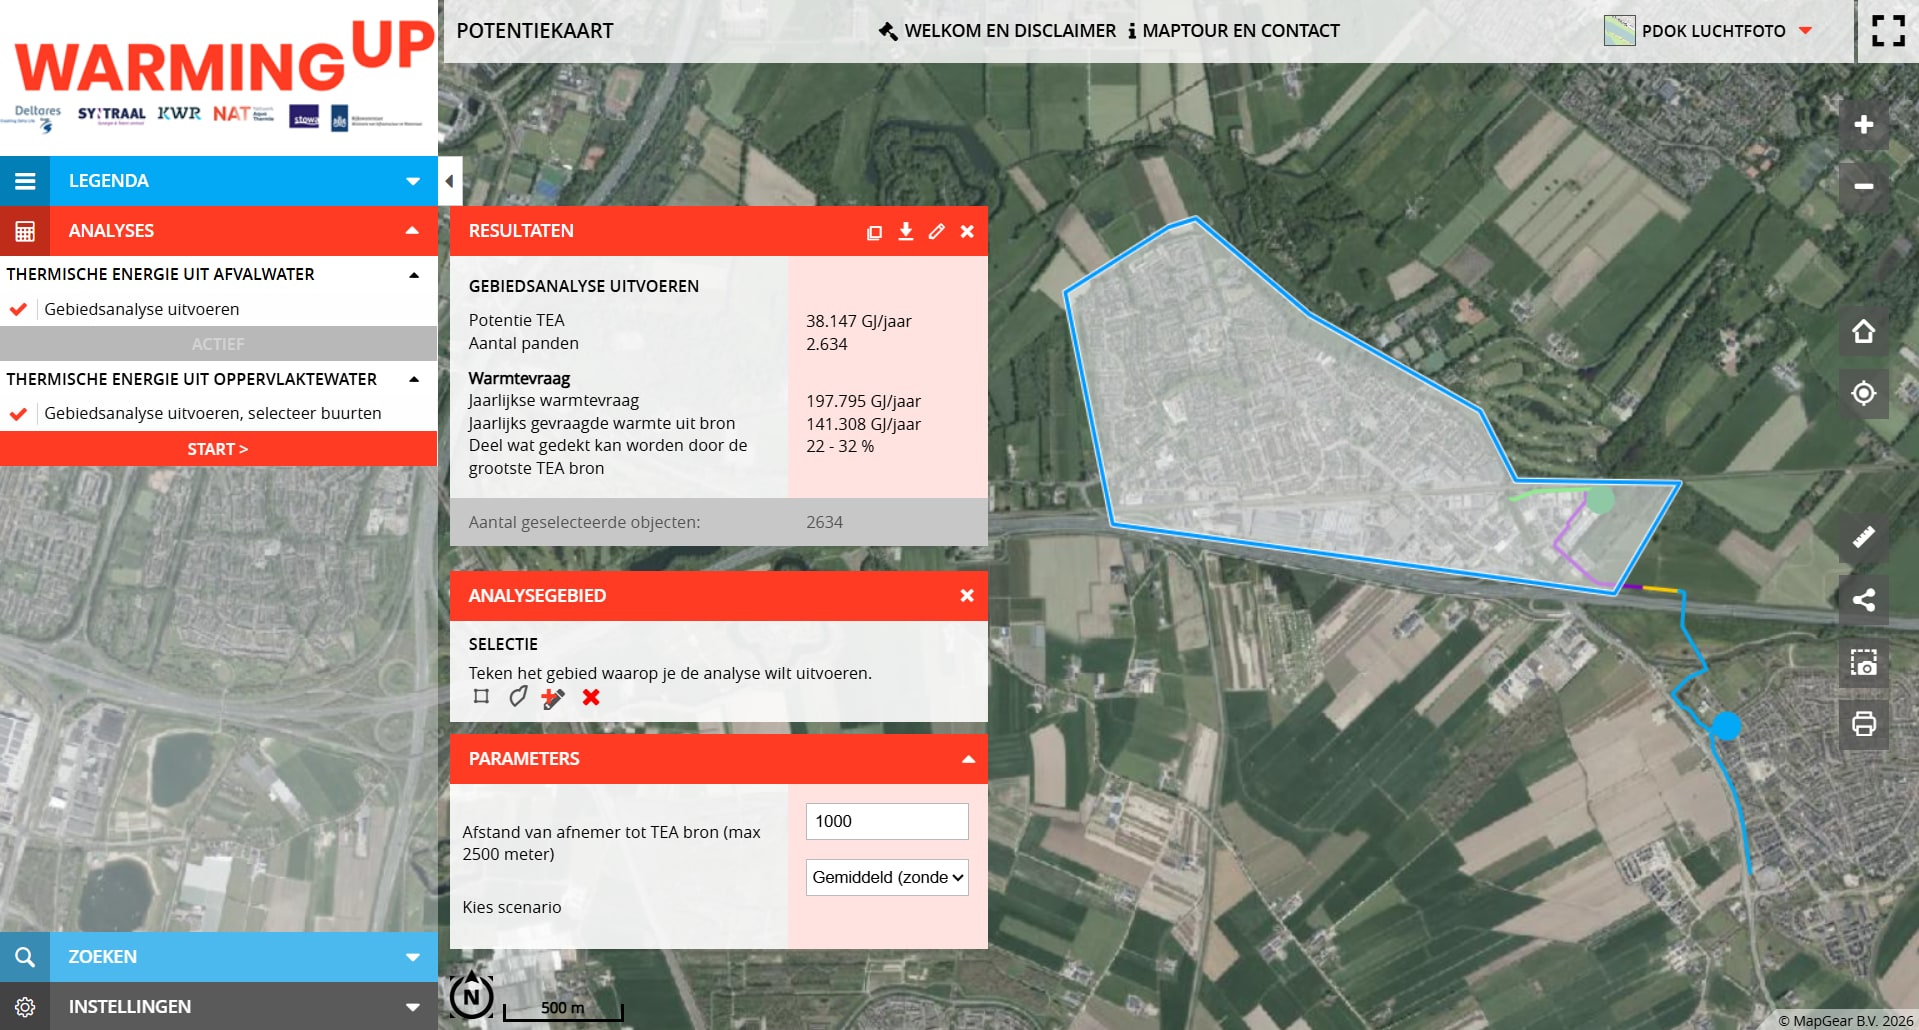
Example · WarmingUP Aquathermie Viewer — not Heat Insight, a public viewer showing how the workflow can look
At a glance, neighbourhoods that may qualify for TEO, TEA or TED, related to local demand.
Supply means little without demand. Link thermal energy in waters and pipes to demand per neighbourhood.
Extraction regimes, ecological risk, ATES capacity, distance to demand and heat-network prospects.
What share of heat demand TEO can cover under different conditions — including multiple extractions.
Example · WarmingUP (not the product)
The national WarmingUP Aquathermie Viewer is a public working example: not an ESG Maps product, but the same kind of workflow. It started as a way to make research potential explorable. Users — municipalities, energy strategists, water authorities — kept using it. Deltares, Syntraal and STOWA contributed knowledge. Open the live viewer or the MapTour to see how quickscan, demand, deepening and area analysis come together in a GIS environment.
Open the example (viewer)This is how a heat-from-water viewer can work
01 / 03
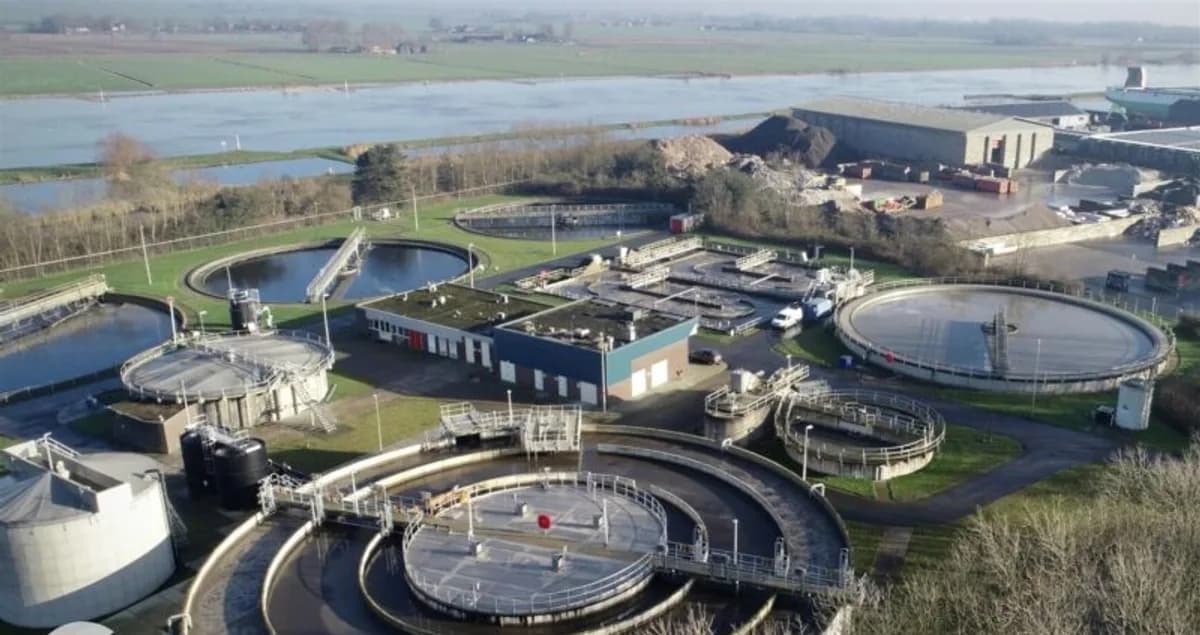
The source in the landscape
TEA starts with wastewater, TEO with surface water, TED with drinking water. Potential is only usable once you link it to neighbourhoods that need heat.
WarmingUP’s Aquathermie Viewer is a public national map for heat from water. It is a useful example of this workflow, not the Heat Insight product. Heat Insight is the version that lives in ESG Maps, next to your other layers.
Zoom to a region, switch TEO, TEA and TED, and run an area analysis. Built by WarmingUP on GeoApps.
Open the mapThe same national viewer, under a public URL you can share with colleagues.
Open the public siteThe MapTour explains the layers in order: quickscan, demand, deepening, then area analysis.
Start the MapTourThe story of how a potential map became a tool people kept using after the research programme ended.
Read the article“When heat from water looks promising, extra research into local conditions is always needed.”
High technical potential does not automatically mean a project. The MapTour and viewer make that explicit: select first, then inspect the factors, then calculate an area. Large-scale use needs an area vision for heat from water — source depletion, downstream effects, interference between extractions, and agreements on allocation and permitting.
Different heat-extraction regimes for TEO and TEA show how reliable the source is, not only how much heat it theoretically holds.
Cold-water discharges and temperature differences belong in the spatial trade-off. Water authorities need that picture next to the energy question.
An area vision for heat from water feeds the heat-transition plan, where those sources are weighed against other heat options.
Current page
Heat Insight sits in the ESG Maps platform, together with insulation, urban heat, green and your other sustainability layers, so sources, demand and liveability share one picture.
Heat Insight
Experiences from organisations working with ESG Maps.
“Calculations that used to take us a week are now done in minutes. That saves us a huge amount of time and money.”

“ESG-Maps has helped us plan and deliver our energy transition projects more efficiently.”
“Developers invest a lot in greening, but it was hard to see what that actually delivered overall. With the new analysis we could draw up a concrete green balance for the first time.”

“We present our expertise as interactive map applications, not dry reports. Colleagues without technical knowledge can use them too - ESG-Maps is an essential foundation for policy-making.”
“ESG-Maps has helped us make sustainability data accessible to everyone. The platform combines powerful visualisation with an easy user experience.”
“Together with MapGear (ESG-Maps) we built a realistic solar potential forecast for Groningen in 2035 - combining data on roofs, heat pumps, electric driving and policy choices.”

“Together with MapGear (ESG-Maps) we developed the TransitiePlanner for energy, climate adaptation and mobility. We are building a dynamic dossier for sustainable business parks.”
“With Asbestdakenkaart we finally have an overview of our asbestos data and remediation progress. One place to prioritise, monitor and report.”
“Calculations that used to take us a week are now done in minutes. That saves us a huge amount of time and money.”
“ESG-Maps has helped us plan and deliver our energy transition projects more efficiently.”
“Developers invest a lot in greening, but it was hard to see what that actually delivered overall. With the new analysis we could draw up a concrete green balance for the first time.”
“We present our expertise as interactive map applications, not dry reports. Colleagues without technical knowledge can use them too - ESG-Maps is an essential foundation for policy-making.”
“ESG-Maps has helped us make sustainability data accessible to everyone. The platform combines powerful visualisation with an easy user experience.”
“Together with MapGear (ESG-Maps) we built a realistic solar potential forecast for Groningen in 2035 - combining data on roofs, heat pumps, electric driving and policy choices.”
“Together with MapGear (ESG-Maps) we developed the TransitiePlanner for energy, climate adaptation and mobility. We are building a dynamic dossier for sustainable business parks.”
“With Asbestdakenkaart we finally have an overview of our asbestos data and remediation progress. One place to prioritise, monitor and report.”
Request a demo of Heat Insight: quickscan, deepening and area analysis, linked to your other sustainability maps.
Answers about heat from water, the WarmingUP viewer and Heat Insight.
TEO is thermal energy from surface water, TEA from wastewater and TED from drinking water. The WarmingUP Aquathermie Viewer and Heat Insight make the potential of these three sources spatially accessible and link it to heat demand per neighbourhood.
The WarmingUP viewer is a public example (knowledge from Deltares, Syntraal and STOWA among others), not part of the Heat Insight product. You will find it at warmingup.geoapps.nl/aquathermie and aquathermieviewer.nl; the MapTour explains the structure. Heat Insight brings the same kind of workflow — quickscan, demand, deepening, area analysis — into ESG Maps, next to your other municipal layers.
No. The MapTour is clear: the viewer is a first step. Extra local research remains necessary. Large-scale application needs an area vision for heat from water, including cumulative extractions, ecological effects and permitting.
Yes. Linking heat supply in waters and pipes to demand per neighbourhood aligns with RES and heat-transition plans. An area vision for heat from water is input for the broader comparison of heat options.
Besides TEO, TEA and TED you can include waste heat, ground energy and heat networks, so you compare options spatially instead of in separate reports.
Yes. API access and export to common formats are available. Connections with ArcGIS, QGIS and municipal or regional portals are possible.
Contact
Questions about our products? Looking for a demo or quote? Fill in the form and we will get back to you.
Fill out the form and we will contact you within 24 hours, or book .