“Calculations that used to take us a week are now done in minutes. That saves us a huge amount of time and money.”
Local insulation on the map
ESG Maps brings energy labels, building characteristics and neighbourhood patterns together so Dutch municipalities can prioritise local insulation approaches — without claiming a subsidy calculator or project tracker the map does not provide.
More information
Calculations that used to take us a week are now done in minutes. That saves us a huge amount of time and money.
Harry de Brauw
Energy transition advisor
Trusted by municipalities, provinces and organisations in the Netherlands and Belgium























































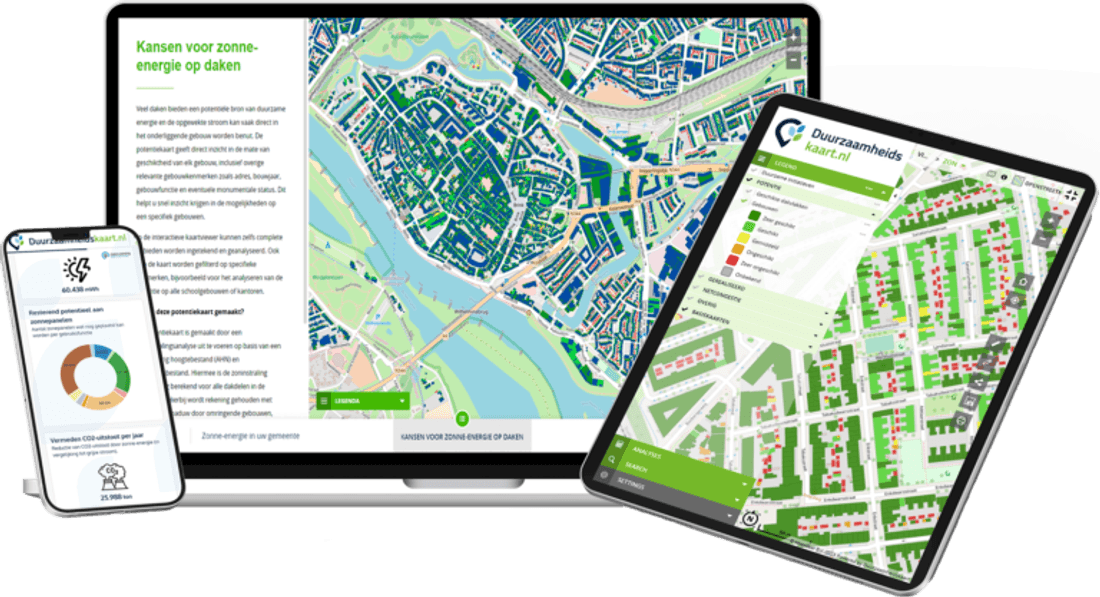
Insulation is often the first step in making homes more energy-efficient. A city-wide average hides where older stock, weaker labels and energy poverty actually sit. The map makes those differences usable for a neighbourhood approach.
Labels
EP-online & BAG
Neighbourhoods
Compare and prioritise
Policy
Local insulation approach
Residents
Clearer targeting
Policy officers and advisers see energy labels and indicative insulation potential per home or neighbourhood. Filter by housing type, construction year and ownership so you can see where a local approach is most worthwhile — and where to combine insulation with heat or solar-on-roof.
Combine energy labels, housing type and construction year to prioritise insulation opportunities for neighbourhood plans, housing associations and resident communication. The map supports targeting; it does not replace an energy adviser or a subsidy application.
Dutch municipalities use local insulation approaches to help homeowners take the first step. The map shows where that work is concentrated. Subsidy schemes such as LAI and ISDE remain the responsibility of the schemes themselves; the map helps you see where communication and targeting make sense.
Insulation is often the first practical step before heat-network choices or solar-on-roof. The map shows where weaker labels and older stock cluster.
Filter by neighbourhood, home type and ownership so you can plan block-by-block work with housing associations and residents — not a municipality-wide slogan.
Homeowners still apply via official schemes. You use the map to see where information and outreach are most needed, not to auto-calculate entitlements.
Spatial insight for a local insulation approach. Not a resident portal, not automatic delivery monitoring, not a subsidy calculator.
Official labels with building characteristics so you can see improvement potential per home or neighbourhood.
See where a neighbourhood or housing-association programme is most worthwhile.
Use maps to explain why a neighbourhood is in scope — without storing extra personal data you do not need.
Insulation sits next to heat, solar and green so you do not run a separate spreadsheet for each theme.
Case study · Gennep
The municipality wanted a grip on energy labels, building characteristics and the local insulation programme. ESG Maps makes the task visible per building and neighbourhood — and records progress.
Read the Gennep projectGennep steers home insulation by neighbourhood and tenure

01 / 02
A Limburg municipality on the Meuse
Gennep chose the platform to steer home insulation, not only to measure it.
Current page
Home insulation sits in the ESG Maps platform with heat, solar and other sustainability layers, so a local insulation approach is not a separate silo.
Home insulation
Experiences from organisations working with ESG Maps.
“Calculations that used to take us a week are now done in minutes. That saves us a huge amount of time and money.”
“Developers invest a lot in greening, but it was hard to see what that actually delivered overall. With the new analysis we could draw up a concrete green balance for the first time.”

“We present our expertise as interactive map applications, not dry reports. Colleagues without technical knowledge can use them too - ESG-Maps is an essential foundation for policy-making.”
“ESG-Maps has helped us make sustainability data accessible to everyone. The platform combines powerful visualisation with an easy user experience.”
“Together with MapGear (ESG-Maps) we built a realistic solar potential forecast for Groningen in 2035 - combining data on roofs, heat pumps, electric driving and policy choices.”

“Together with MapGear (ESG-Maps) we developed the TransitiePlanner for energy, climate adaptation and mobility. We are building a dynamic dossier for sustainable business parks.”

“ESG-Maps has helped us plan and deliver our energy transition projects more efficiently.”
“With Asbestdakenkaart we finally have an overview of our asbestos data and remediation progress. One place to prioritise, monitor and report.”
“Calculations that used to take us a week are now done in minutes. That saves us a huge amount of time and money.”
“Developers invest a lot in greening, but it was hard to see what that actually delivered overall. With the new analysis we could draw up a concrete green balance for the first time.”
“We present our expertise as interactive map applications, not dry reports. Colleagues without technical knowledge can use them too - ESG-Maps is an essential foundation for policy-making.”
“ESG-Maps has helped us make sustainability data accessible to everyone. The platform combines powerful visualisation with an easy user experience.”
“Together with MapGear (ESG-Maps) we built a realistic solar potential forecast for Groningen in 2035 - combining data on roofs, heat pumps, electric driving and policy choices.”
“Together with MapGear (ESG-Maps) we developed the TransitiePlanner for energy, climate adaptation and mobility. We are building a dynamic dossier for sustainable business parks.”
“ESG-Maps has helped us plan and deliver our energy transition projects more efficiently.”
“With Asbestdakenkaart we finally have an overview of our asbestos data and remediation progress. One place to prioritise, monitor and report.”
Request a demo to see energy labels and neighbourhood priorities on your own municipal area.
Answers about Home Insulation.
We combine official energy labels (EP-online) with BAG and building characteristics. Where extra sources are available they can be added. That supports an indication of insulation potential per home or neighbourhood — not a guaranteed saving per address.
Yes. You filter by neighbourhood, home type, label and ownership. That helps you prioritise areas and discuss insulation alongside heat or solar-on-roof with housing associations and residents.
No. Official subsidy schemes stay with the issuing authorities. The map helps you see where insulation is likely relevant so you can target information; homeowners still apply through the official channels.
We only process data that may be used for this purpose (including labels and BAG). For policy and reporting we work with aggregated or anonymised views where that is appropriate. Processing follows GDPR.
Contact
Questions about our products? Looking for a demo or quote? Fill in the form and we will get back to you.
Fill out the form and we will contact you within 24 hours, or book .