“With Asbestdakenkaart we finally have an overview of our asbestos data and remediation progress. One place to prioritise, monitor and report.”
Asbestos remediation & inventory
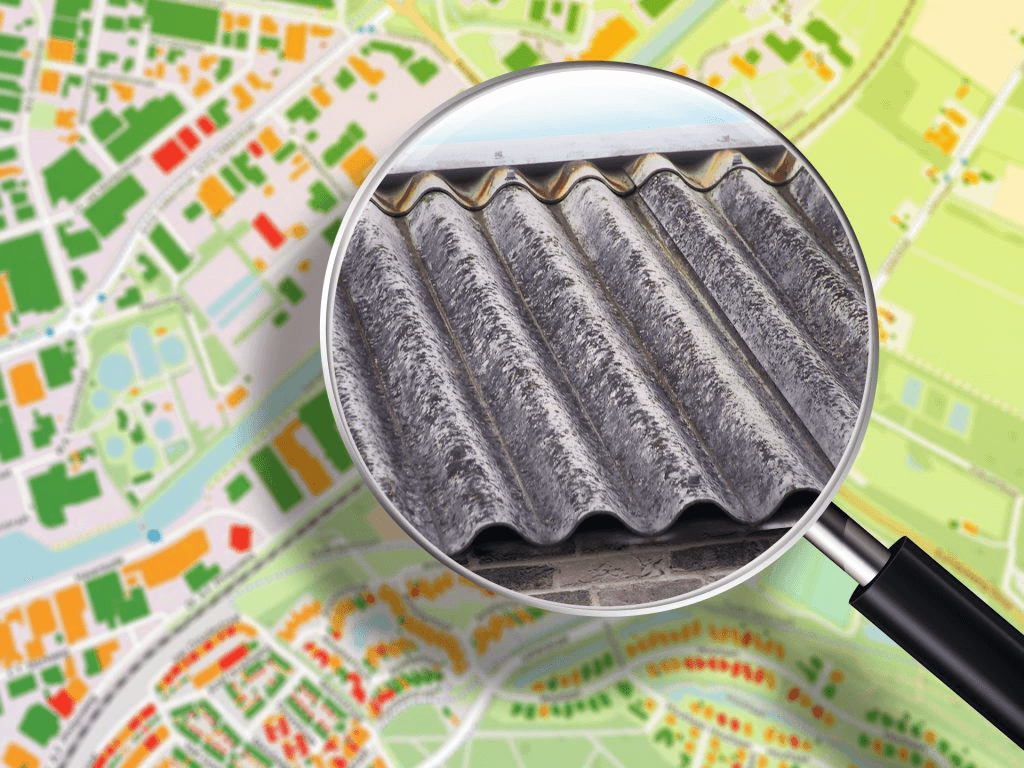
Many authorities already have asbestos roof data, but no easy way to track remediation progress. Asbestos Roof Map is the tool to manage your data, monitor remediation and link subsidies.
More information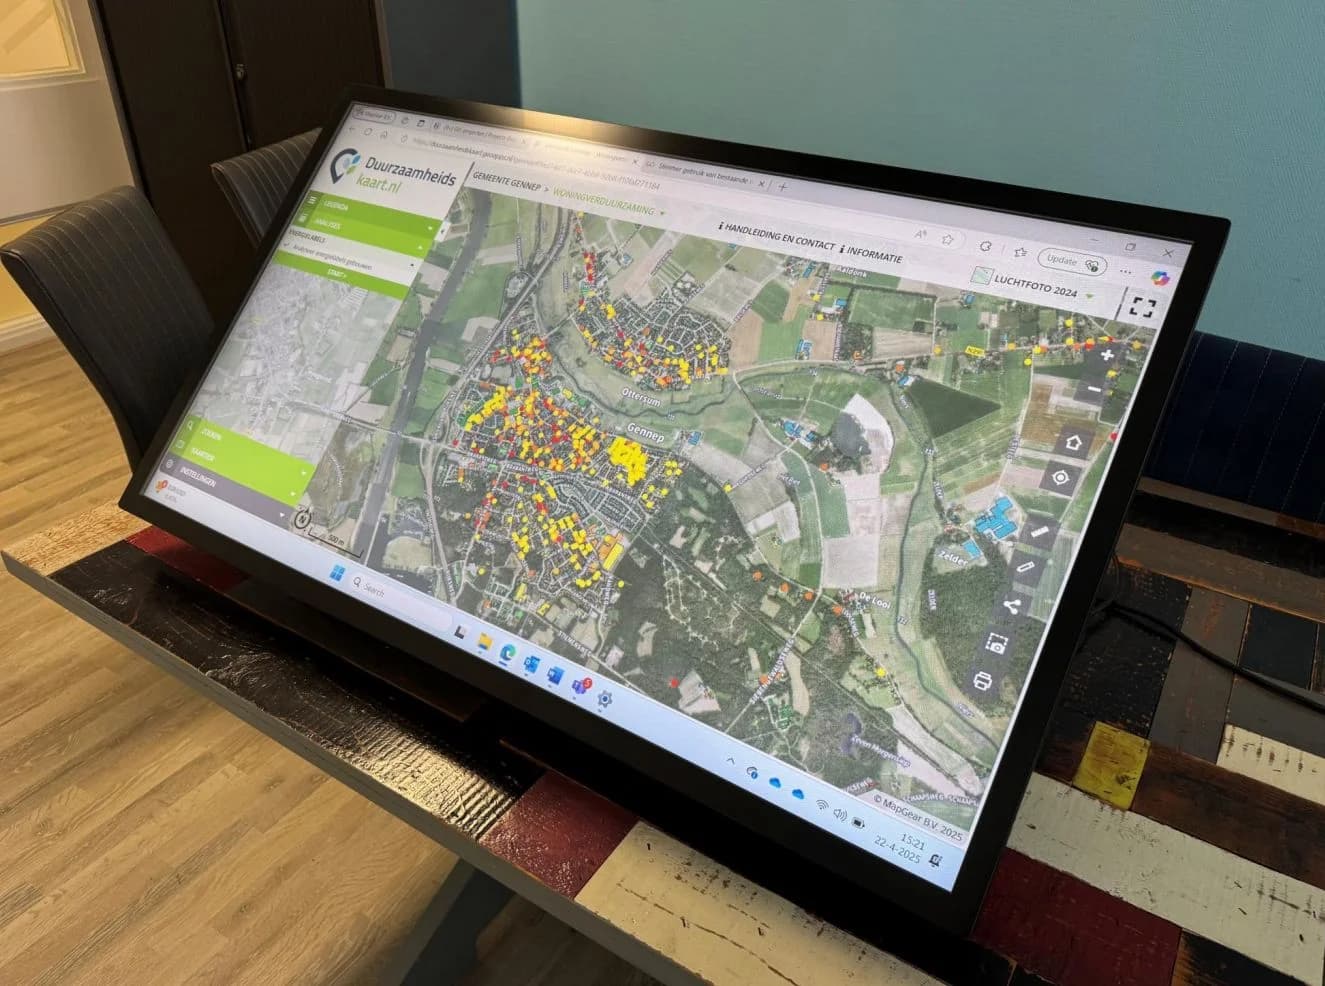
With Asbestdakenkaart we finally have an overview of our asbestos data and remediation progress. One place to prioritise, monitor and report.
Province of Drenthe
Asbestos roof policy
Trusted by municipalities, provinces and organisations in the Netherlands and Belgium


















































Asbestos is not only a health risk but also hinders the energy transition. Safe remediation is key to successful home sustainability.
Health
Limit risks
Safety
Planned remediation
Sustainability
Energy transition
Subsidy
Support where possible
Policy officers and advisers see per building whether asbestos is present on the roof, what the remediation priority is and how this fits sustainability plans.
Combine roof data, construction years and map layers to identify suspected asbestos roofs, prioritise action and link remediation to sustainability work such as solar or insulation.
Request a demoMany authorities already have asbestos roof data but lack a way to track, report and steer remediation progress. Asbestos Roof Map fills that gap.
Many authorities already have data (aerial photos, notifications, own inventories), but it is fragmented. No central picture to steer or report on.
Who has already been remediated? What is planned? Without a tool, progress is hard to track and report to administration or national government.
Where subsidy or accountability matters, you want to link data and remediation progress. That needs one management tool.
Not a detection tool, but a management tool: bring existing asbestos roof data together, track remediation progress and link subsidies and reporting. All in one place.
Bring existing asbestos roof data together on one map: locations, status, condition. Filter by risk, building type or district.
Track which roofs are remediated or planned. Follow progress, plan capacity and report.
Link subsidy information or applications to your asbestos data and remediation progress (e.g. LAI, sustainability).
Reports and compliance support for all stakeholders.
Case study · Drenthe
Remediation cases were processed carefully, but the public map lagged by up to two weeks. Automatic sync makes what is finished internally visible to residents straight away.
Read the Drenthe projectDrenthe keeps the asbestos roof map in step with the register
01 / 02
Provincial asbestos roof map
For residents the map is the public confirmation that a remediation is recognised.
Current page
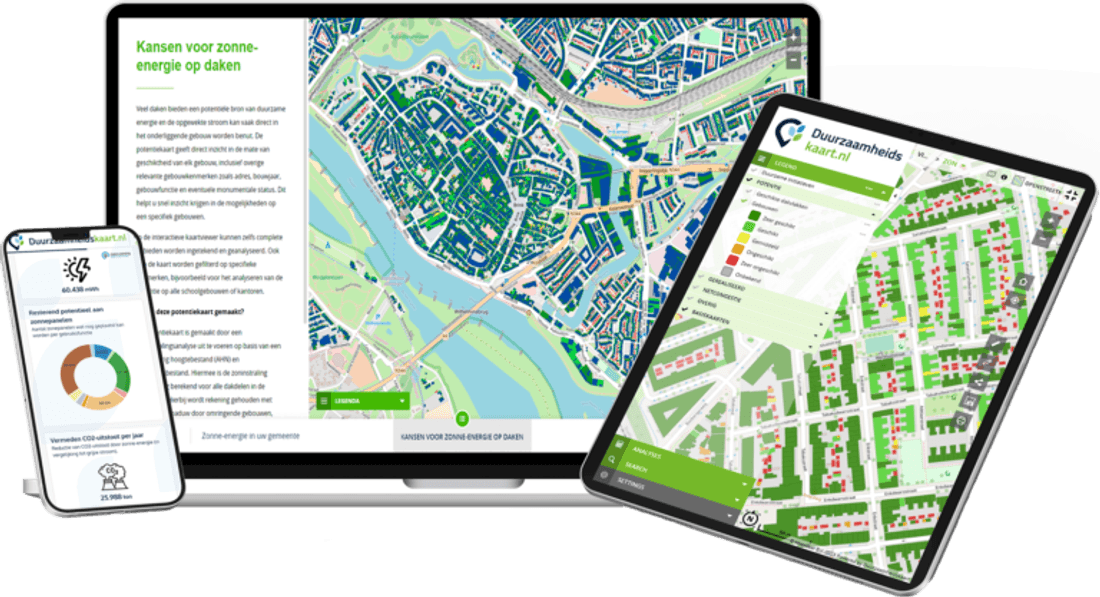
Asbestos Roof Map is part of the ESG Maps platform. Manage your asbestos data and remediation progress alongside your other sustainability data in one environment.
Asbestos Roof Map
Experiences from organisations working with ESG Maps.
“With Asbestdakenkaart we finally have an overview of our asbestos data and remediation progress. One place to prioritise, monitor and report.”
“Developers invest a lot in greening, but it was hard to see what that actually delivered overall. With the new analysis we could draw up a concrete green balance for the first time.”

“Calculations that used to take us a week are now done in minutes. That saves us a huge amount of time and money.”

“We present our expertise as interactive map applications, not dry reports. Colleagues without technical knowledge can use them too - ESG-Maps is an essential foundation for policy-making.”
“ESG-Maps has helped us make sustainability data accessible to everyone. The platform combines powerful visualisation with an easy user experience.”
“Together with MapGear (ESG-Maps) we built a realistic solar potential forecast for Groningen in 2035 - combining data on roofs, heat pumps, electric driving and policy choices.”

“Together with MapGear (ESG-Maps) we developed the TransitiePlanner for energy, climate adaptation and mobility. We are building a dynamic dossier for sustainable business parks.”

“ESG-Maps has helped us plan and deliver our energy transition projects more efficiently.”
“With Asbestdakenkaart we finally have an overview of our asbestos data and remediation progress. One place to prioritise, monitor and report.”
“Developers invest a lot in greening, but it was hard to see what that actually delivered overall. With the new analysis we could draw up a concrete green balance for the first time.”
“Calculations that used to take us a week are now done in minutes. That saves us a huge amount of time and money.”
“We present our expertise as interactive map applications, not dry reports. Colleagues without technical knowledge can use them too - ESG-Maps is an essential foundation for policy-making.”
“ESG-Maps has helped us make sustainability data accessible to everyone. The platform combines powerful visualisation with an easy user experience.”
“Together with MapGear (ESG-Maps) we built a realistic solar potential forecast for Groningen in 2035 - combining data on roofs, heat pumps, electric driving and policy choices.”
“Together with MapGear (ESG-Maps) we developed the TransitiePlanner for energy, climate adaptation and mobility. We are building a dynamic dossier for sustainable business parks.”
“ESG-Maps has helped us plan and deliver our energy transition projects more efficiently.”
Request a demo to put data, progress and subsidy in one management tool.
Answers about Asbestos Roof Map.
We combine aerial photos, BAG data, historical notifications and (where available) earlier inventories. The map gives a risk estimate per roof; a recognised asbestos survey or inspection remains needed for definitive determination. The map helps prioritise and plan.
You can filter by building type, risk class, age and location. That helps you set delivery plans, link remediation to e.g. solar-on-roof or insulation, and support subsidy and communication processes towards owners.
We offer export and API connections so you can exchange data with your own systems, subsidy portals and national or regional asbestos registers. We are happy to discuss the desired connection.
All processing is GDPR-compliant. Personal data is not stored unnecessarily; for policy and communication we work with aggregated or anonymised data where possible. Owners can exercise their rights via the responsible authority.
Contact
Questions about our products? Looking for a demo or quote? Fill in the form and we will get back to you.
Fill out the form and we will contact you within 24 hours, or book .