From policy to delivery
Sustainability policy, permits and participation in one platform
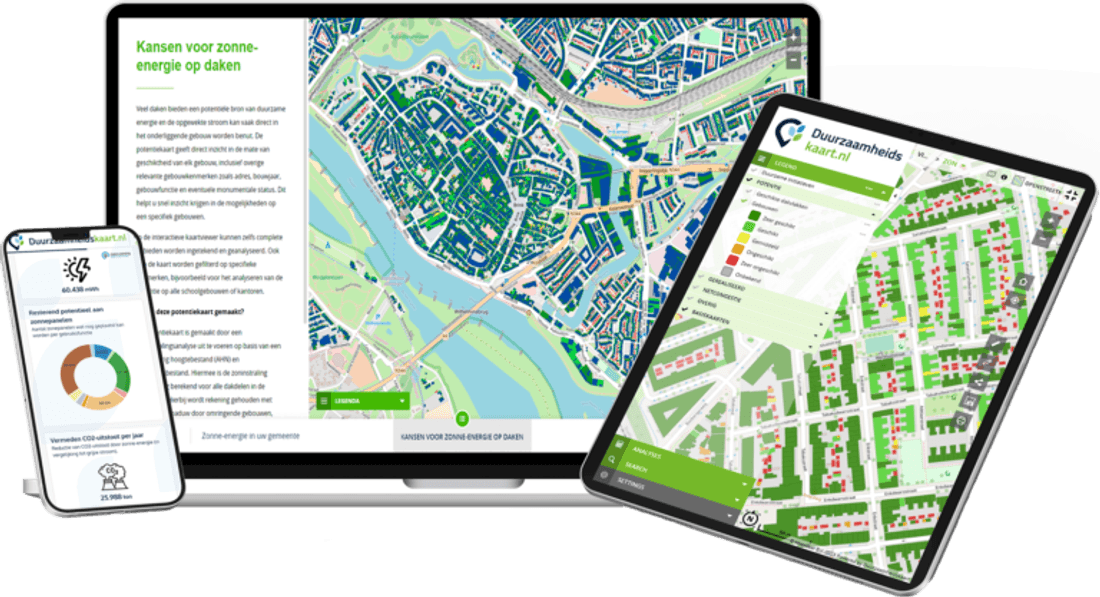
ESG Maps gives you current insight into sustainable opportunities in your municipality or province: solar, heat, heat stress and climate adaptation. We make your sustainability data visual and easy to grasp: everything in one place, with effective tools for analysis and monitoring. User-friendly and interactive.
ESG Maps products are already used by:
Trusted by municipalities, provinces and organisations in the Netherlands and Belgium


















































Applications
How ESG Maps supports your organisation.
Climate adaptation
Monitor heat, drought and flood risks and track progress on measures.
Energy & RES
Solar and heat potential and regional energy strategy agreements at a glance.
Permits
Support for environmental permits and enforcement with up-to-date data.
Why ESG Maps?
Up-to-date data
Always current maps and indicators for policy and permits.
One platform
Climate, energy, green space and environment in one central environment.
Fast insight
Maps and reports ready immediately for council, executives and residents.
“ESG Maps has helped us make sustainability data accessible to everyone. The platform combines powerful visualisation with a simple user experience.”
Experiences
For policy officers
As a policy officer, you can monitor heat and drought risks and progress with the Climate Adaptation Monitor and report to council.
For permit officers
As a permit officer, you can underpin environmental permits with Solar Insight, Species Management Plan and current aerial imagery.
For participation officers
As a participation officer, you can use solar and heat maps at residents' evenings and in online tools for citizens.
Relevant products
These ESG Maps products match your organisation type.
Climate Adaptation Monitor
Monitor heat, drought and flood risks and track progress on measures.
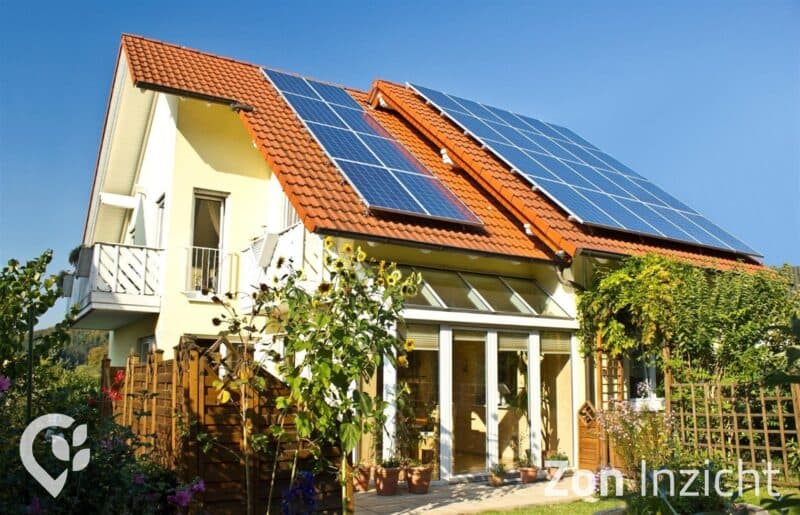
Solar Insight
User-friendly map viewer for solar energy with a public tool for residents.
Heat Insight
Insight into heat sources, heat demand and options for gas-free heating.
Heat Stress Insight
Three practical maps for heat challenges: distance to cool spots, shade on walking routes and green space per neighbourhood.
Green Insight
Instant insight into the amount and type of green space with the 3-30-300 rule integrated.
Asbestos Roof Map
Asbestos roof inventory and support for planned sustainability upgrades.
Species Management Plan
Protected species and ecology mapped for permits and area development.
Home insulation
Insight into insulation quality and energy savings for the housing stock.
Sustainability table
Present maps and data for executives, council or residents, live or online.
Participation & consultation
Engage residents in spatial plans with the Sustainability table, MapTalk and co-creation.
GIS & GEO
Sustainability data in your GIS. Integration with GeoApps.
What does a municipality gain?
Answers for policy, council and delivery — not the same FAQ as other audiences.
Yes. Indicators and maps are meant to feed both analysis and board presentation, without a second “PowerPoint version” of the data.
Often yes: ESG-Maps provides thematic insights and communication maps that sit beside or inside your GIS. We start from your decision, not a full landscape migration.
Municipalities get product lines (heat, solar, climate adaptation, species, …) with fixed indicators and reports — aligned to municipal processes, not only drawing on a map.
Contact
Want to know more?
Questions about our products? Looking for a demo or quote? Fill in the form and we will get back to you.
Fill out the form and we will contact you within 24 hours, or book .