“We present our expertise as interactive map applications, not dry reports. Colleagues without technical knowledge can use them too - ESG-Maps is an essential foundation for policy-making.”
TouchTable × ESG Maps
Present maps for council and residents.
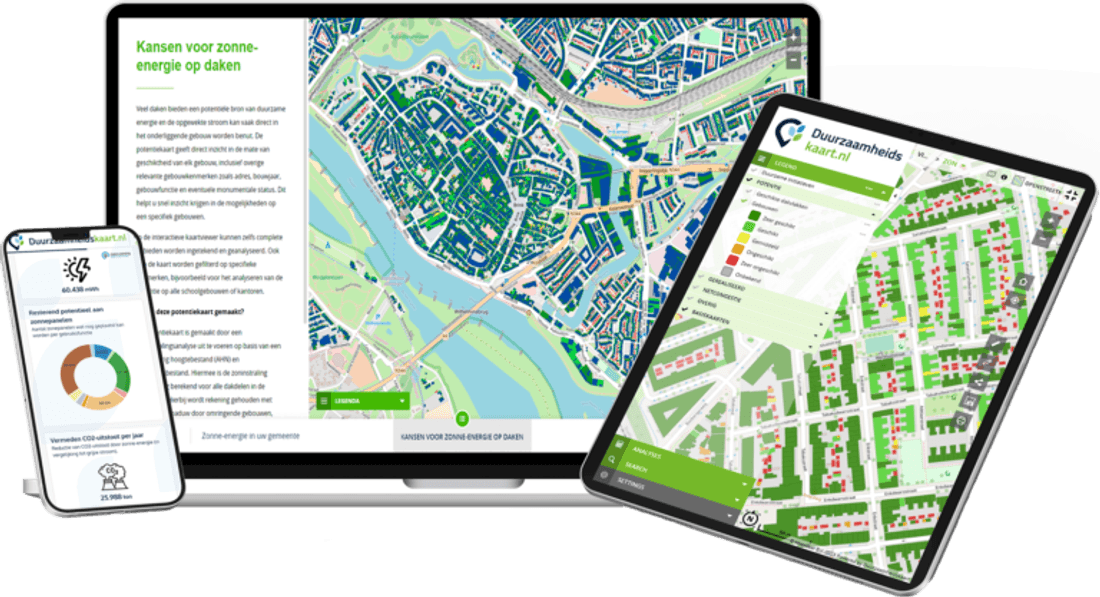
Present maps and sustainability data clearly — live in the council chamber or online — on the interactive TouchTable.
More information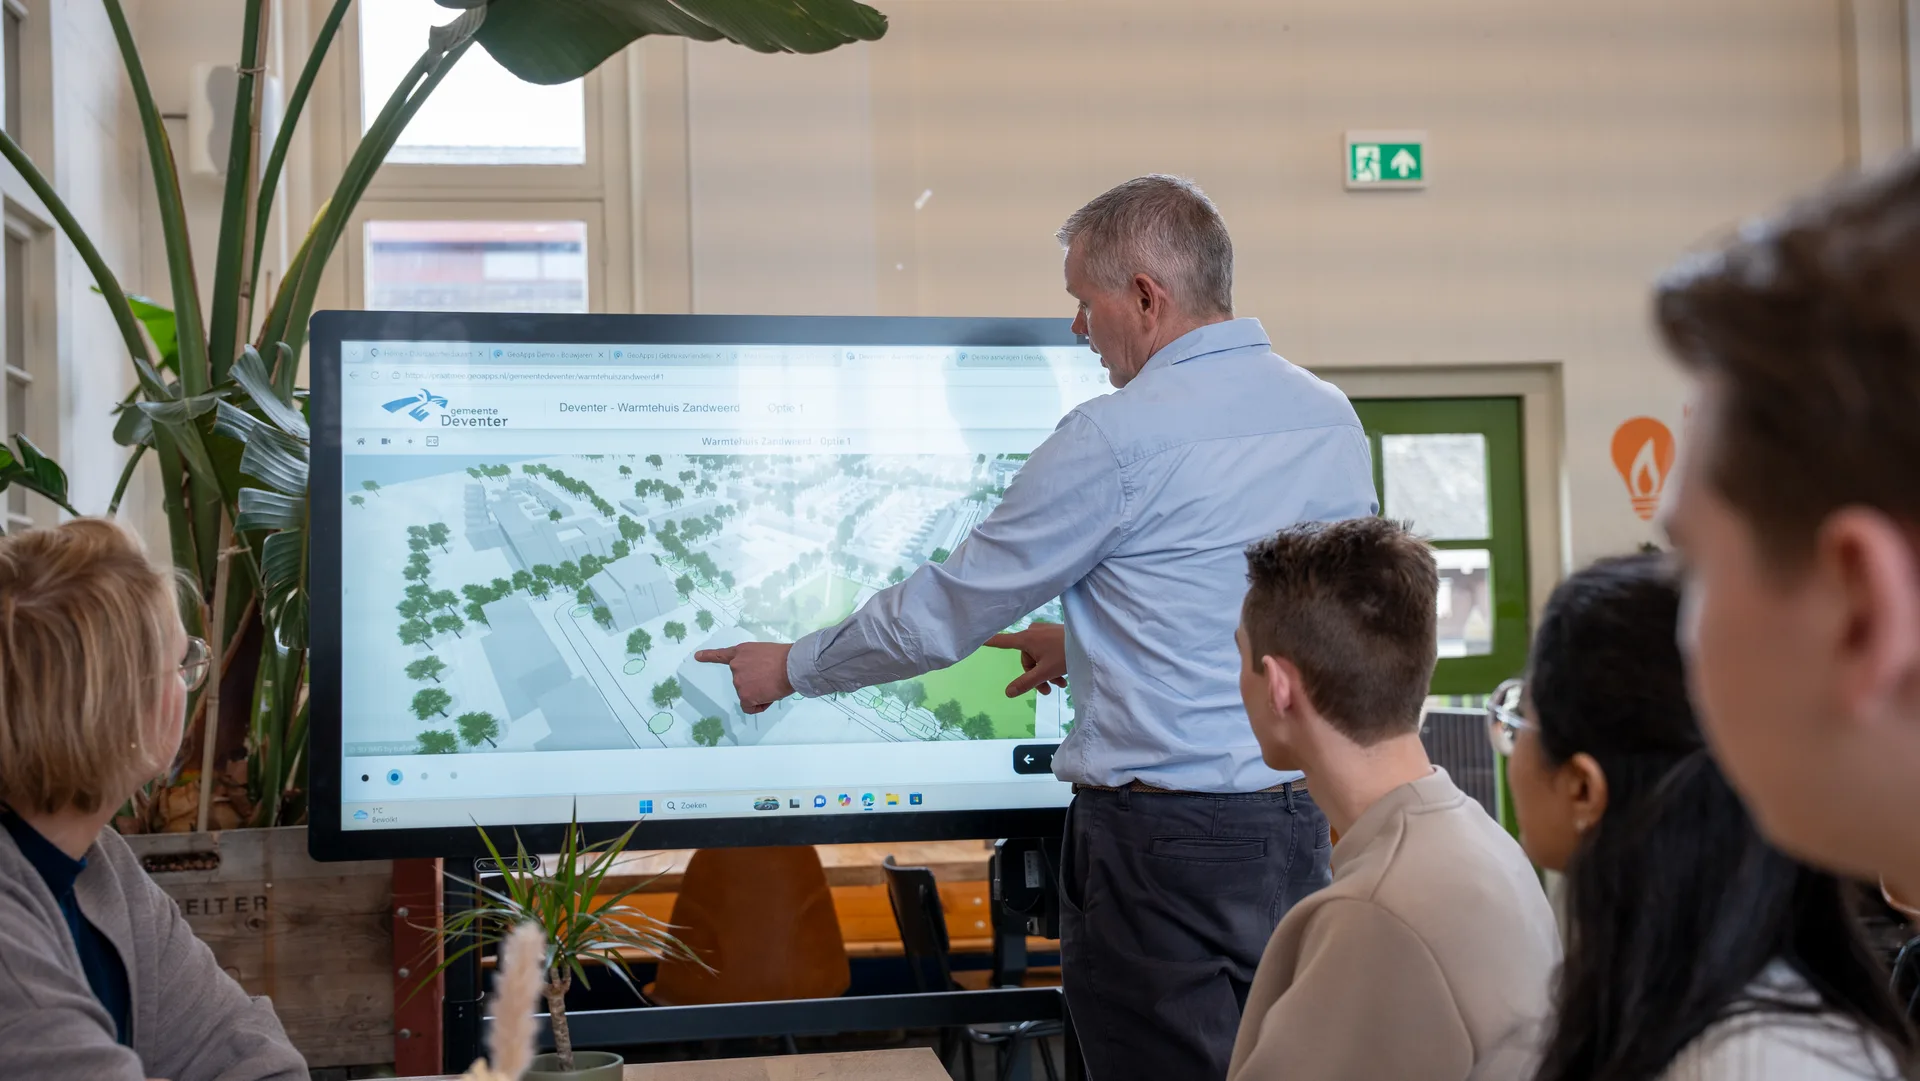
We present our expertise as interactive map applications, not dry reports. Colleagues without technical knowledge can use them too - ESG-Maps is an essential foundation for policy-making.
Simon Bos
Syntraal (voormalig)
Trusted by municipalities, provinces and organisations in the Netherlands and Belgium


















































Complex maps and data only work when presented clearly. The sustainability table is your interactive surface for executives, council or residents: make your message understandable and persuasive.
Executive board
Clear visuals
Council
Live in the chamber
Residents
Online or on screen
Data
Current & accessible
Connect the sustainability table to your ESG Maps data: the same maps and dashboards you use internally, now optimised for large touch displays and hybrid sessions.
Create presentation-ready views and dashboards for meetings, reports or display screens. The data stays current and easy to explain.
Request a demoFrom prepared dashboards to live exploration during a residents' meeting.
Build presentation-ready views you share in meetings, reports or on screen. Data stays current and accessible.
Interactive sessions: executives, council or residents follow along and point at the map. Ideal for council meetings or neighbourhood sessions.
In the room or remote , the same maps and data, clear and professional.
Adjust detail and wording per audience , without rebuilding everything.
Short lines, clear KPIs and scenarios that support policy choices.
Transparent maps and explanations that speed up debate and decisions.
Accessible visualisations that improve participation and support.
Current page
The sustainability table connects to your existing maps, layers and reporting. Not a silo: one platform for analysis and presentation.
Sustainability table
Experiences from organisations working with ESG Maps.
“We present our expertise as interactive map applications, not dry reports. Colleagues without technical knowledge can use them too - ESG-Maps is an essential foundation for policy-making.”
“Developers invest a lot in greening, but it was hard to see what that actually delivered overall. With the new analysis we could draw up a concrete green balance for the first time.”

“Calculations that used to take us a week are now done in minutes. That saves us a huge amount of time and money.”
“ESG-Maps has helped us make sustainability data accessible to everyone. The platform combines powerful visualisation with an easy user experience.”
“Together with MapGear (ESG-Maps) we built a realistic solar potential forecast for Groningen in 2035 - combining data on roofs, heat pumps, electric driving and policy choices.”

“Together with MapGear (ESG-Maps) we developed the TransitiePlanner for energy, climate adaptation and mobility. We are building a dynamic dossier for sustainable business parks.”

“ESG-Maps has helped us plan and deliver our energy transition projects more efficiently.”
“With Asbestdakenkaart we finally have an overview of our asbestos data and remediation progress. One place to prioritise, monitor and report.”
“We present our expertise as interactive map applications, not dry reports. Colleagues without technical knowledge can use them too - ESG-Maps is an essential foundation for policy-making.”
“Developers invest a lot in greening, but it was hard to see what that actually delivered overall. With the new analysis we could draw up a concrete green balance for the first time.”
“Calculations that used to take us a week are now done in minutes. That saves us a huge amount of time and money.”
“ESG-Maps has helped us make sustainability data accessible to everyone. The platform combines powerful visualisation with an easy user experience.”
“Together with MapGear (ESG-Maps) we built a realistic solar potential forecast for Groningen in 2035 - combining data on roofs, heat pumps, electric driving and policy choices.”
“Together with MapGear (ESG-Maps) we developed the TransitiePlanner for energy, climate adaptation and mobility. We are building a dynamic dossier for sustainable business parks.”
“ESG-Maps has helped us plan and deliver our energy transition projects more efficiently.”
“With Asbestdakenkaart we finally have an overview of our asbestos data and remediation progress. One place to prioritise, monitor and report.”
Book an on-site or online demonstration and see how presenting ESG Maps works on the interactive table.
Practical answers about the sustainability table.
It is the TouchTable used as a presentation solution for sustainability data, linked to ESG Maps. MapGear supplies hardware and software; we help with setup and content.
Yes. You reuse the same datasets and styles where possible, optimised for touch and large displays during presentations.
Yes. You can present at the table while remote participants follow the same visuals and maps.
Contact
Questions about our products? Looking for a demo or quote? Fill in the form and we will get back to you.
Fill out the form and we will contact you within 24 hours, or book .