“Together with MapGear (ESG-Maps) we built a realistic solar potential forecast for Groningen in 2035 - combining data on roofs, heat pumps, electric driving and policy choices.”
Solar Insight Residential
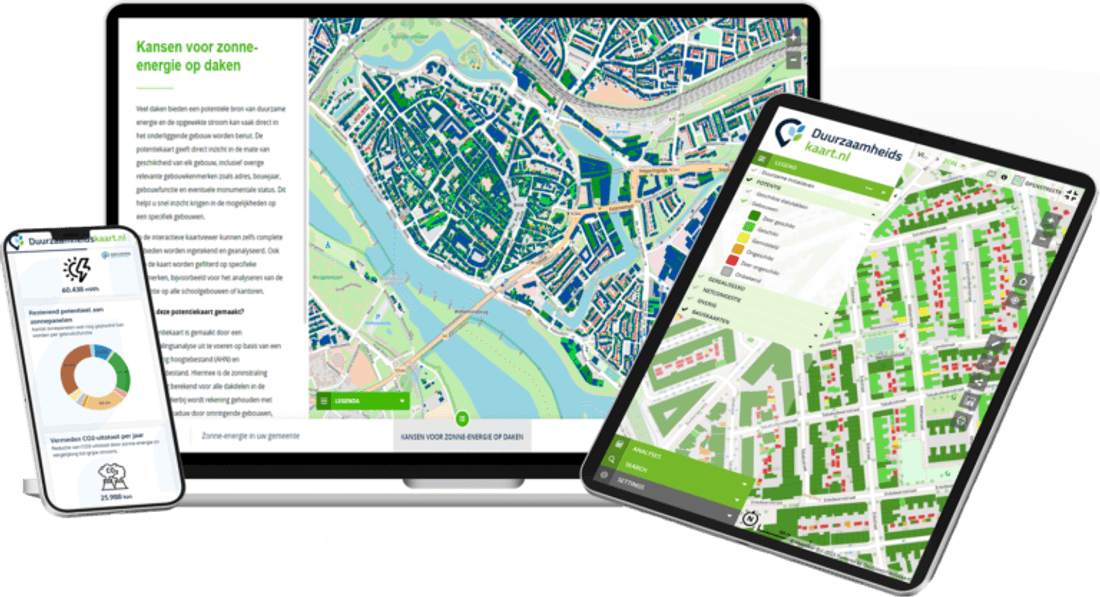
An accessible solar map so residents can see if their roof is suitable for solar panels and what the estimated yield is. Ideal to inform residents — you deploy it, they explore on their own.
More information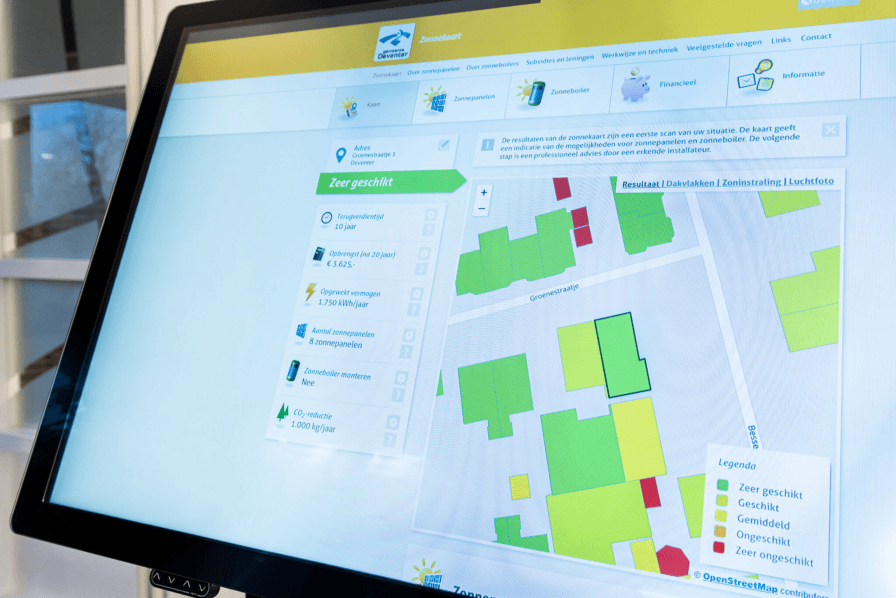
Together with MapGear (ESG-Maps) we built a realistic solar potential forecast for Groningen in 2035 - combining data on roofs, heat pumps, electric driving and policy choices.
Joris van de Ven
Syntraal
Trusted by municipalities, provinces and organisations in the Netherlands and Belgium
















































Authorities and municipalities use the Solar Map to inform and encourage residents. Residents do not need policy data or detections – they want one answer: is this for me? With a simple calculation and clear view of roof potential and yield, you help them answer that question.
Residents enter an address and immediately see whether their roof is suitable and what the estimated yield is. No complex dashboards – just clear answers.
The map makes solar energy concrete and accessible. Ideal to involve residents in the energy transition without technical overload.
The resident Solar Map connects to the ESG Maps platform. For policy and monitoring: Solar Map Pro.
More about Solar Map ProA simple map showing residents their roof potential and estimated yield – without technical knowledge or policy dashboards.
The resident map shows only what citizens need. Under the hood you share roof potential and realisation with Solar Insight Pro and panel detection.
Suitability and yield in plain language.
Technical background per address.
Where panels are already installed.
Stack map layers in your viewer or portal
Practice example · Leiden
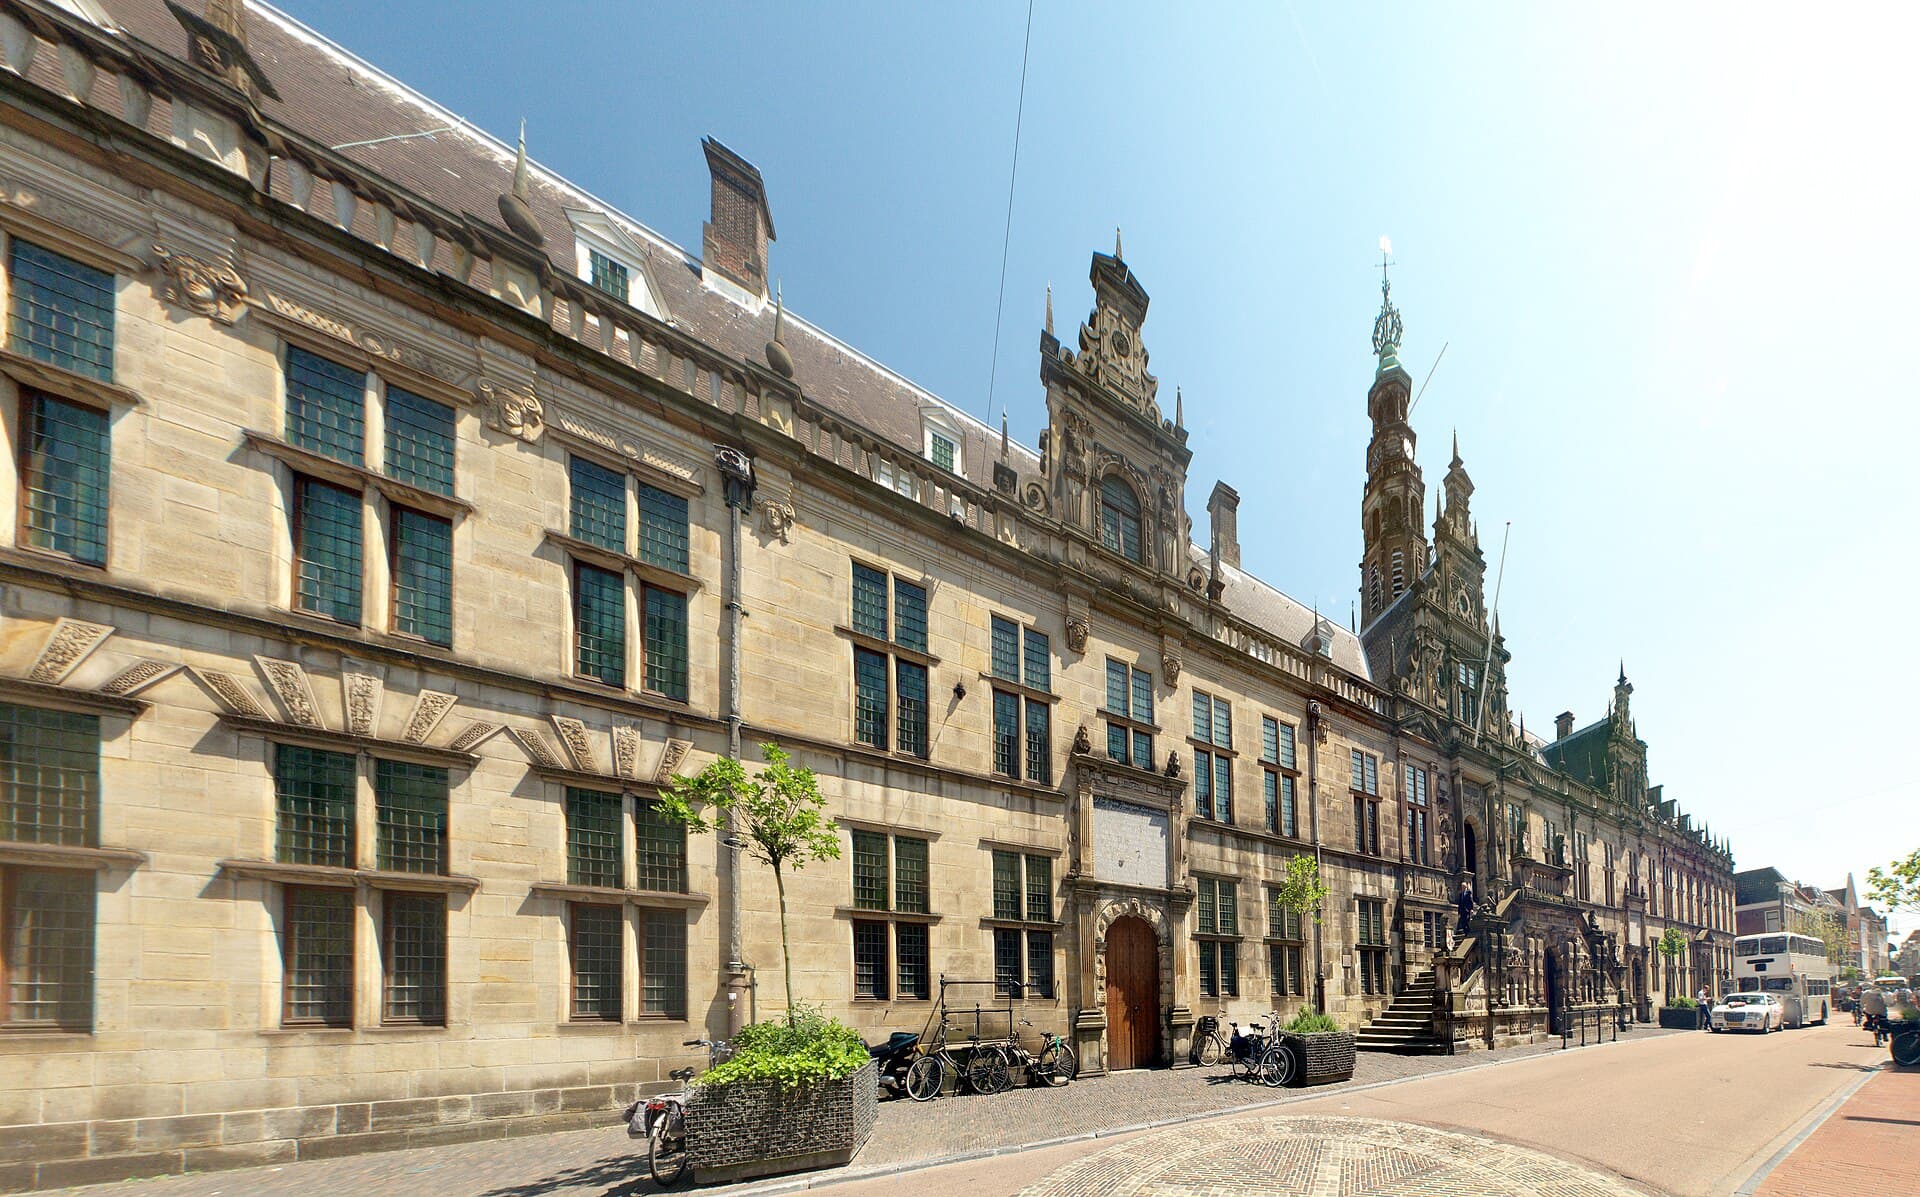
The Dutch municipality of Leiden lets residents check solar-on-roof in the same map environment as green roofs — including historic-city rules so it is clear where panels may be visible from the street.
Read the Leiden caseLeiden already uses a public solar map
01 / 02
A city residents already know
One public map for sustainable roof choices, not a separate PDF per theme.
Current page
Solar Insight Residential connects to the ESG Maps platform, with monitoring via Solar Insight Pro and detections as map layers.
Solar Insight Residential
Monitoring and detections are separate products — with the same stackable layers.
Solar monitor, dashboards and RES reporting.
Panels on aerial imagery — annual and accurate.
All solar solutions in one place.
Experiences from organisations working with ESG Maps.
“Together with MapGear (ESG-Maps) we built a realistic solar potential forecast for Groningen in 2035 - combining data on roofs, heat pumps, electric driving and policy choices.”
“Developers invest a lot in greening, but it was hard to see what that actually delivered overall. With the new analysis we could draw up a concrete green balance for the first time.”
“Calculations that used to take us a week are now done in minutes. That saves us a huge amount of time and money.”
“We present our expertise as interactive map applications, not dry reports. Colleagues without technical knowledge can use them too - ESG-Maps is an essential foundation for policy-making.”
“ESG-Maps has helped us make sustainability data accessible to everyone. The platform combines powerful visualisation with an easy user experience.”

“Together with MapGear (ESG-Maps) we developed the TransitiePlanner for energy, climate adaptation and mobility. We are building a dynamic dossier for sustainable business parks.”

“ESG-Maps has helped us plan and deliver our energy transition projects more efficiently.”
“With Asbestdakenkaart we finally have an overview of our asbestos data and remediation progress. One place to prioritise, monitor and report.”
“Together with MapGear (ESG-Maps) we built a realistic solar potential forecast for Groningen in 2035 - combining data on roofs, heat pumps, electric driving and policy choices.”
“Developers invest a lot in greening, but it was hard to see what that actually delivered overall. With the new analysis we could draw up a concrete green balance for the first time.”
“Calculations that used to take us a week are now done in minutes. That saves us a huge amount of time and money.”
“We present our expertise as interactive map applications, not dry reports. Colleagues without technical knowledge can use them too - ESG-Maps is an essential foundation for policy-making.”
“ESG-Maps has helped us make sustainability data accessible to everyone. The platform combines powerful visualisation with an easy user experience.”
“Together with MapGear (ESG-Maps) we developed the TransitiePlanner for energy, climate adaptation and mobility. We are building a dynamic dossier for sustainable business parks.”
“ESG-Maps has helped us plan and deliver our energy transition projects more efficiently.”
“With Asbestdakenkaart we finally have an overview of our asbestos data and remediation progress. One place to prioritise, monitor and report.”
Request a demo for the public solar map for your municipality or province.
Contact
Questions about our products? Looking for a demo or quote? Fill in the form and we will get back to you.
Fill out the form and we will contact you within 24 hours, or book .