Skip to main contentSkip to navigation
ExploreAbout usContactJobs
Log in
MapGear Logo
NewsAbout MapGearJobs
Log inContact
MapGear, known through GeoAppsGeoApps
GeoApps Logo
Apps
Solutions
Platform
About us
Subscriptions
Get advice
GeoApps Logo

GeoApps is the leading software platform for GIS applications and spatial data, enabling organizations to make data-driven decisions.

Solutions

  • Urban Planning
  • Infrastructure
  • Real Estate
  • Environment & Climate
  • Energy Transition
  • Safety & Risk
  • GIS solutions

Products

  • GeoApps
  • Solutions
  • ESG-Maps
  • MapServices
  • TouchTable
  • Consultation
  • Platform

Apps

  • Viewer
  • Dashboard
  • Fieldwork
  • MapTour
  • MapTalk
  • Custom
  • QGIS plugin

For whom?

  • Municipalities
  • Provinces
  • Environmental Services
  • Engineering
  • Contractors
  • Safety Regions
  • Water authorities

Platform

  • Integrations
  • Documentation
  • GIS Lexicon
  • System Status
  • Changelog
  • Support
  • Subscriptions

Company

  • About Us
  • Careers
  • Contact
  • Partners
  • News & Blog
  • Events
  • Case studies

Stay up-to-date

Subscribe to our newsletter to get the latest updates on our products and services. You can unsubscribe at any time.

Keep an eye on our socials too

Stay connected with us through our social media channels and get the latest updates on our products and services.

Quality & trust

MapGear is ISO 9001 and ISO 27001 certified and meets the highest quality and security standards for our products and services.

ISO 9001 Certificering
ISO 27001 Certificering
QGIS Membership 2026
© 2026 MapGear B.V. All rights reserved.
Terms & conditionsPrivacy PolicySustainability statement
CBAM 2026: Carbon Data in the Definitive Regime | GeoApps Blog
Featured image for CBAM 2026: What the Definitive Regime Means for Carbon Data
View All Posts
📸 Featured
News

CBAM 2026: What the Definitive Regime Means for Carbon Data

CBAM entered its definitive regime in 2026, bringing new authorisation, emissions reporting and certificate obligations for covered imports. For organisations working with carbon and material data, the challenge is increasingly about knowing which data is required for compliance and which additional insights can support better sustainability decisions.

January 5, 2026
Duurzaamheidskaart
4 min

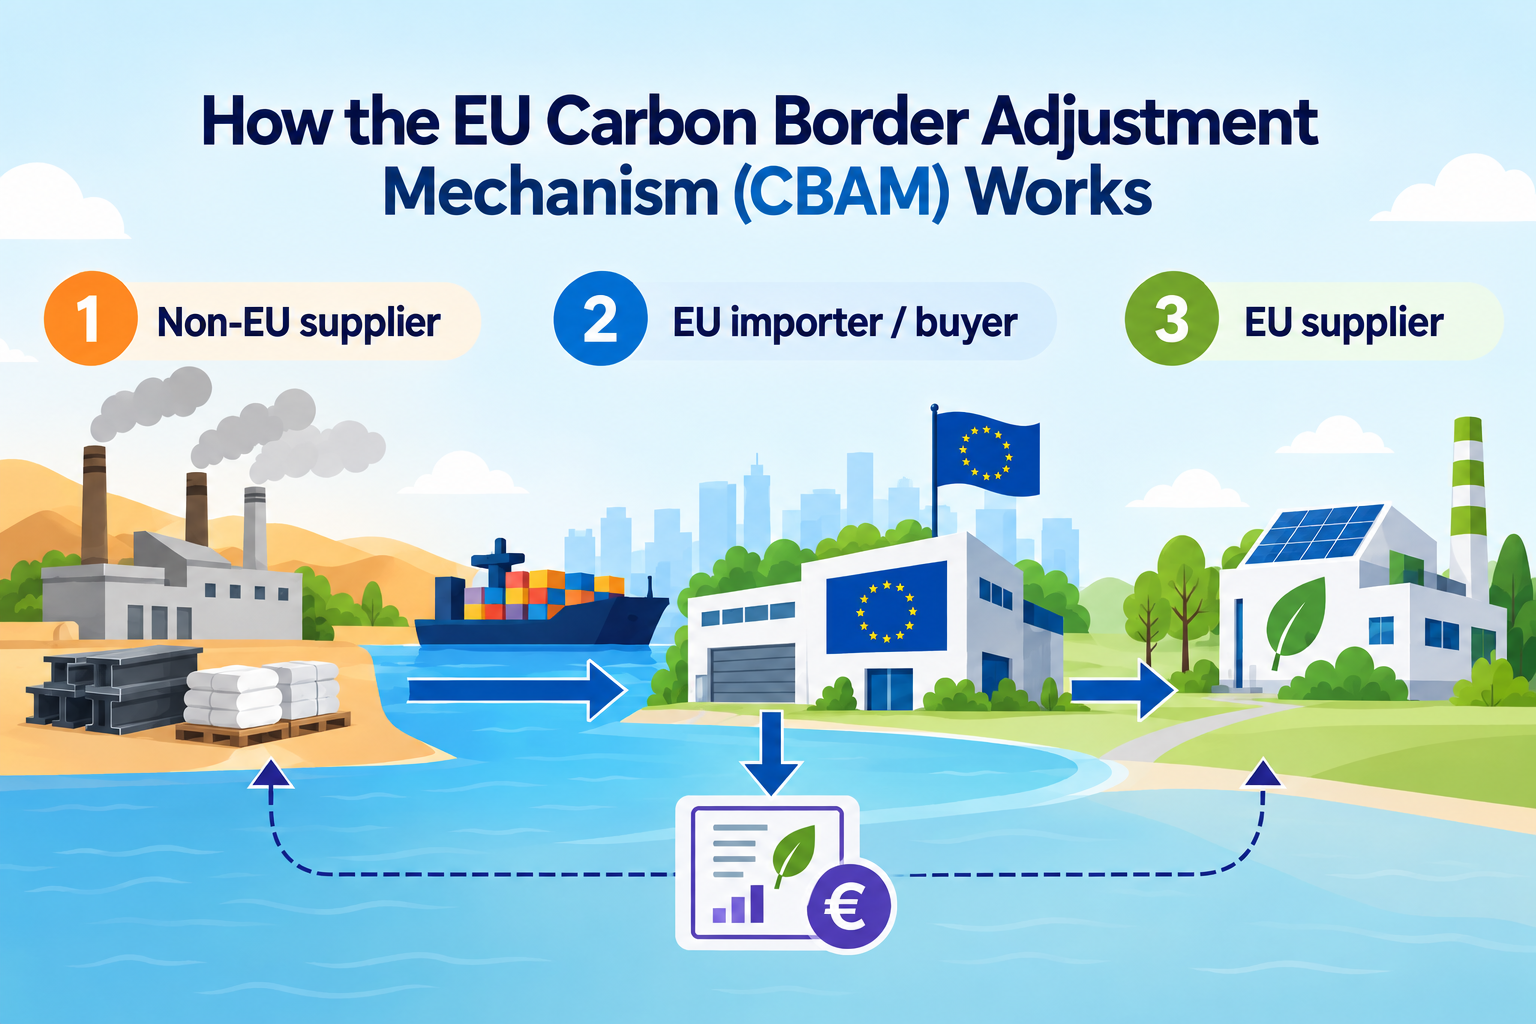
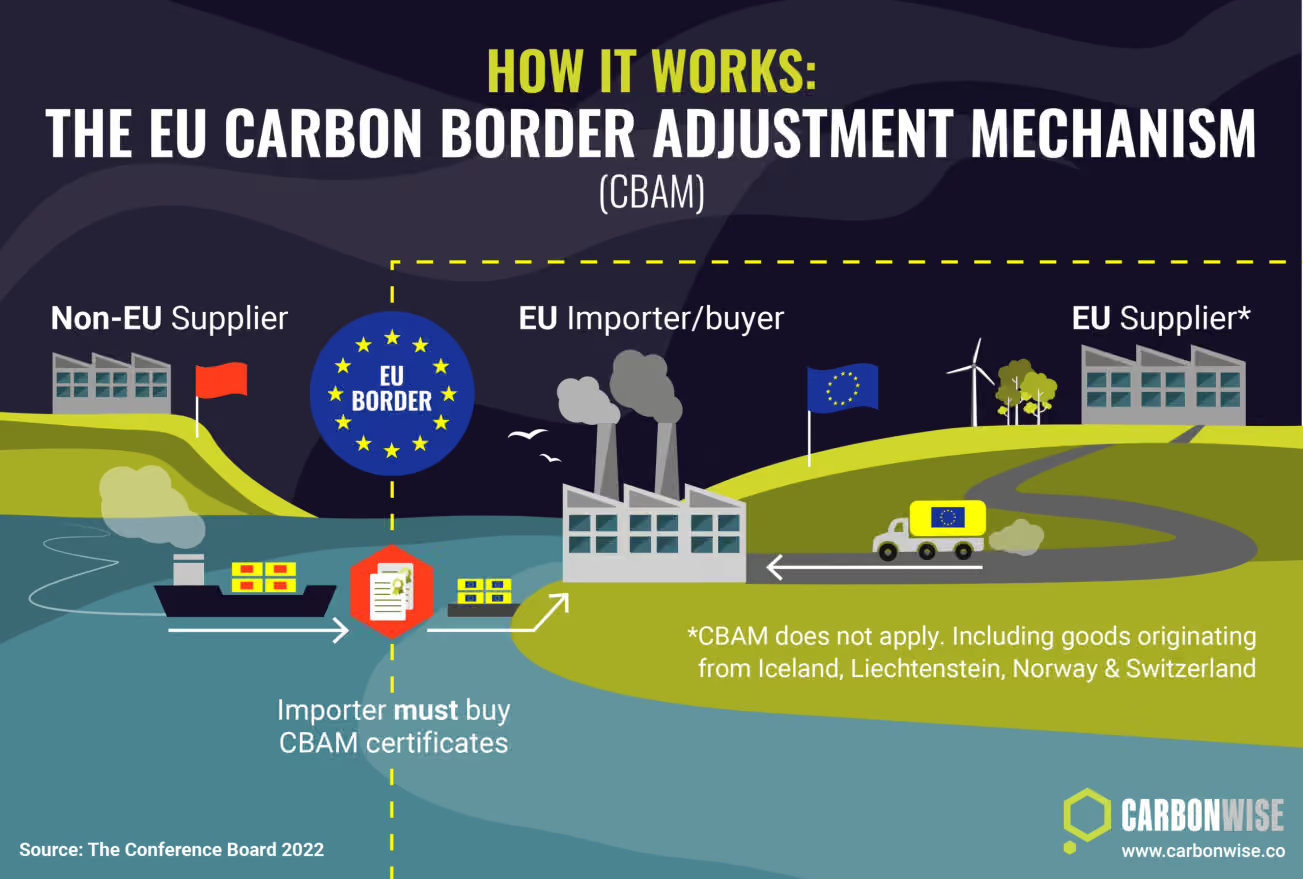
The Carbon Border Adjustment Mechanism entered its definitive regime on 1 January 2026. For companies importing covered goods into the European Union, CBAM is no longer only a transitional reporting exercise. It now introduces authorisation requirements, embedded-emissions reporting and financial obligations linked to CBAM certificates.

The important distinction is that CBAM does not create a general requirement for every organisation to map all materials or emissions geographically. Its legal obligations apply to specific covered imports. However, the regulation highlights a broader challenge that many organisations already recognise: carbon data becomes far more useful when its origin, material context and underlying assumptions are clear.

2026 changed CBAM from preparation to financial responsibility

CBAM currently covers selected goods in cement, iron and steel, aluminium, fertilisers, electricity and hydrogen. For cement, iron and steel, aluminium and fertilisers, the annual mass-based threshold is 50 tonnes per importer. Electricity and hydrogen are not covered by that tonnage exemption.
🖼️
Image not available
This image could not be loaded

Authorised CBAM declarants must report the embedded emissions associated with covered imports and surrender the corresponding number of CBAM certificates. Where a carbon price has already been paid in the country of production, the relevant amount may be deducted under the applicable rules.

The first CBAM declaration covering imports made during 2026 is due by 30 September 2027, together with the corresponding certificate obligations. The Commission allows the use of applicable default values or actual emissions data, with verified producer data required when actual values are used.

Carbon reporting gets harder when the data behind the number is unclear

A carbon figure alone says little unless an organisation understands how it was calculated and what activity or material it represents. Under CBAM, embedded emissions are tied to specific imported goods and production processes, which makes reliable source data increasingly important.

For organisations managing wider sustainability programmes, the same principle applies beyond formal CBAM reporting. Material type, supplier information, emissions factors, project context and production data may exist across different spreadsheets, systems and teams. When those sources are disconnected, it becomes harder to understand why one project, supplier or material choice has a different carbon impact from another.

Bringing this information into a clearer analytical structure can help teams distinguish regulatory data from broader sustainability indicators and make the assumptions behind carbon calculations easier to understand.

Compliance data answers one question. Spatial insight can answer another.

CBAM reporting focuses on the embedded emissions of covered imports. Spatial analysis serves a different purpose: it can help organisations understand where projects, assets, material use or sustainability impacts are located and compare those patterns across areas.

For example, a construction or infrastructure organisation may want to combine project locations with material quantities, emissions factors or other sustainability indicators. Mapping that information can make differences between projects visible and help teams explore where carbon-intensive materials are concentrated or where alternative scenarios may deserve further analysis.

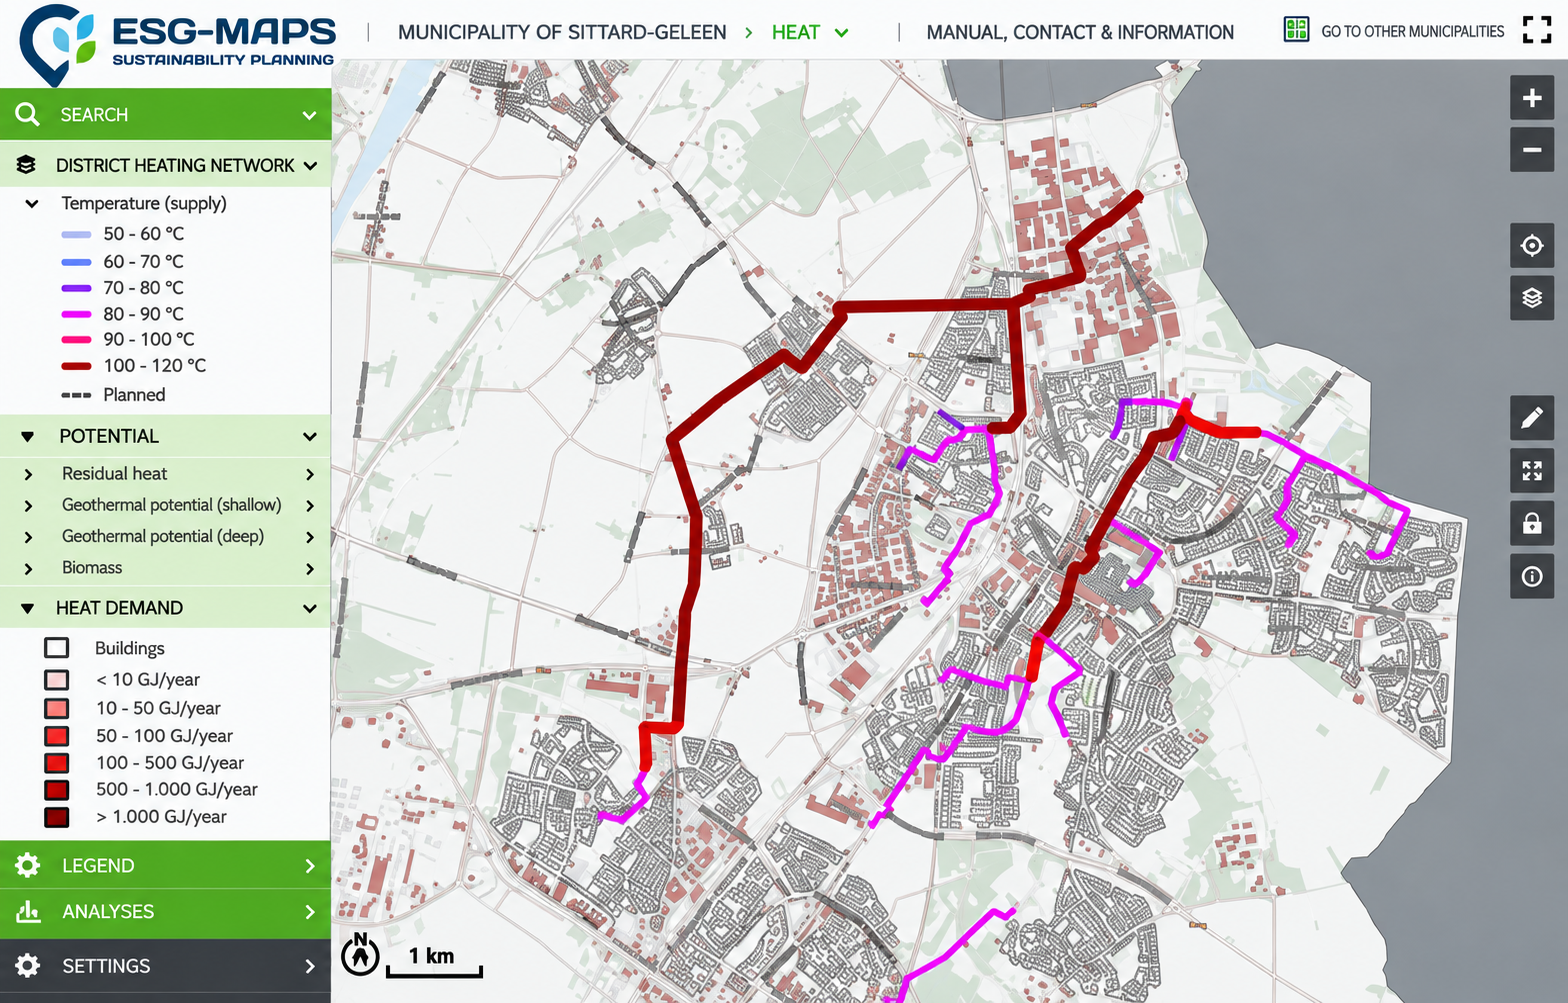
ESG Maps can support this broader sustainability analysis by bringing location-based data, dashboards and reporting into one environment. It does not replace the official CBAM Registry, emissions methodology, verification process or compliance obligations.
🖼️
Image not available
This image could not be loaded

Better carbon decisions start with knowing what the data actually represents

CBAM makes carbon data financially relevant for organisations importing covered goods into the EU. At the same time, it reinforces a lesson that applies more broadly to sustainability reporting: numbers become more useful when organisations can trace them back to the materials, activities and decisions behind them.

The strongest approach is therefore to separate the two needs clearly. Formal CBAM obligations should follow the European Commission’s regulatory methodology and reporting processes, while wider spatial carbon analysis can help organisations understand patterns, compare projects and provide more context for sustainability decisions.

For organisations already working with project, material and location data, that creates an opportunity to move beyond isolated carbon figures towards a clearer view of where impact occurs and which decisions influence it.

Want to explore how ESG Maps can bring carbon, material and project data together spatially?

Request a demo

View All PostsGet a Demo

Related Posts

You might also like

From Rigid to Smart GIS: Why More Organizations Are Switching to QGIS + GeoApps

From Rigid to Smart GIS: Why More Organizations Are Switching to QGIS + GeoApps

Many GIS environments are still stuck in old structures. High license costs, slow updates, and limited collaboration slow down innovation. Discover how organizations are moving to an open, flexible, and future-ready WebGIS with QGIS + GeoApps.

October 14, 2025Read more
How Interactive Maps Bring Clarity to Regional Sustainability Initiatives

How Interactive Maps Bring Clarity to Regional Sustainability Initiatives

Regional sustainability initiatives often become scattered across programmes, organisations and locations. Discover how interactive maps create one shared overview that improves visibility, coordination and collaboration.

September 30, 2025Read more
How Online Maps Help Ecological Consultancy Flourish

How Online Maps Help Ecological Consultancy Flourish

Digital maps make ecological consultancy work more efficient and transparent. Discover how GeoApps supports organizations in nature research, public participation, and policy development.

September 30, 2025Read more
Why GeoApps is the solution for consultancy firms in spatial planning

Why GeoApps is the solution for consultancy firms in spatial planning

GeoApps enables consultancy firms to make open data accessible to non-technical colleagues, work more efficiently, and create new revenue models.

September 30, 2025Read more
Optimal property management with GeoApps: Innovation for housing corporations

Optimal property management with GeoApps: Innovation for housing corporations

GeoApps gives housing corporations full control of their property portfolio. Visualize assets, drive sustainability, and monitor projects in one platform.

September 30, 2025Read more
Rethink Your GIS: Build a More Flexible Spatial Data Architecture

Rethink Your GIS: Build a More Flexible Spatial Data Architecture

Your GIS does not need to be replaced to become more flexible. Open standards, interoperable tools and accessible web applications can help organisations reduce unnecessary dependencies while keeping the systems that still work.

September 29, 2025Read more

Ready to Get Started?

Join thousands of users who are already using GeoApps to transform their spatial data workflows.

Get a Demo
GeoApps Viewer
Gasfabriek project
MapGear team office
Last Updated: September 24, 2026