How Interactive Maps Bring Clarity to Regional Sustainability Initiatives
Regions are increasingly working on multiple sustainability challenges at the same time. Energy transition, circular economy, mobility, climate adaptation, agriculture, innovation and quality of life often involve different organisations, programmes and project teams operating across the same geographic area. As the number of initiatives grows, maintaining a clear overview becomes more difficult because projects may be documented in separate reports, websites or spreadsheets, while stakeholders are not always aware of what is already happening nearby.
As a result, collaboration can become harder and the risk of duplicated efforts, missed connections and fragmented communication increases. A shared interactive map can address this by bringing initiatives together geographically and showing projects, locations, themes and contacts in one environment. In this way, regions can make their sustainability efforts easier to understand, explore and connect.
Make Regional Initiatives Easier to Find
First, one of the biggest challenges in regional collaboration is visibility. Valuable projects may already exist, but businesses, residents, researchers or public organisations may not know where to find them or who is responsible. Therefore, an interactive project map creates a central overview where users can explore initiatives by location and theme instead of searching through separate programme pages or reports.
This makes initiatives around themes such as:
energy transition
circular economy
sustainable agriculture
mobility
innovation
climate adaptation
healthy living environments
skills and workforce development
more accessible to a wider audience. At the same time, users can quickly identify which projects are relevant to their interests or responsibilities.
Connect Projects with the People Who Can Contribute
Moreover, visibility becomes even more valuable when it leads to action. A regional project map can do more than show where an initiative is located because it can also provide practical information about the project, its purpose and the people involved.
By linking projects to contact information or responsible organisations, users can move directly from discovering an initiative to making contact. For example, businesses can find potential partners, researchers can identify relevant programmes and public organisations can see where collaboration opportunities already exist. Consequently, the region becomes more connected and stakeholders can find each other more efficiently.
Turn Scattered Information into One Shared Spatial Overview
In addition, regional sustainability programmes often involve data from many sources. Projects may be organised by different institutions, funded through different programmes or managed by different teams, which makes it difficult to understand how those activities relate to one another.
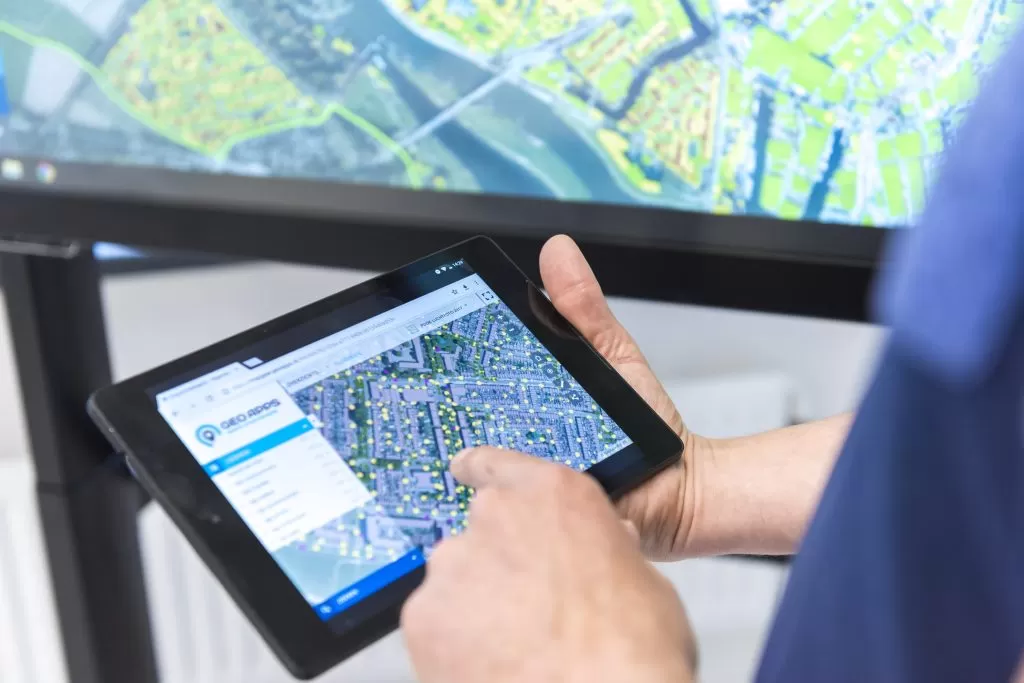
GeoApps brings this information together within an interactive geographic environment. Each initiative can be connected to a location, category and relevant project details, creating a visual overview of how activities are distributed across the region. As a result, decision-makers can more easily identify clusters of activity, areas where several themes overlap and locations where additional initiatives may be needed.
This spatial perspective also creates a clearer link between strategic ambitions and practical implementation. Instead of viewing projects as isolated activities, organisations can see how individual initiatives contribute to broader regional objectives.
Support Collaboration Across Different Organisations
Regional transitions rarely belong to one organisation. Governments, businesses, educational institutions, research organisations and community groups may all contribute to the same sustainability objectives. For that reason, a shared map can provide these groups with a common point of reference.
Rather than each organisation maintaining its own isolated overview, stakeholders can work from the same visual picture of projects and locations. This supports clearer communication and makes it easier to understand how different initiatives contribute to wider regional goals. Furthermore, organisations can identify where resources, expertise or partnerships could be combined.
Make Regional Strategies More Visible
Regional strategies often contain many themes, programmes and objectives that can be difficult for non-specialists to navigate. By translating these strategies into an interactive map, regions can make them easier to explore and understand.
Projects can be grouped according to strategic themes, which allows users to see how individual initiatives contribute to broader ambitions. In turn, this helps connect high-level policy with activity on the ground and makes regional progress more tangible. For residents, businesses and other stakeholders, the map becomes a practical way to understand what a region is working on without having to interpret lengthy policy documents.
A Practical Example from Foodvalley
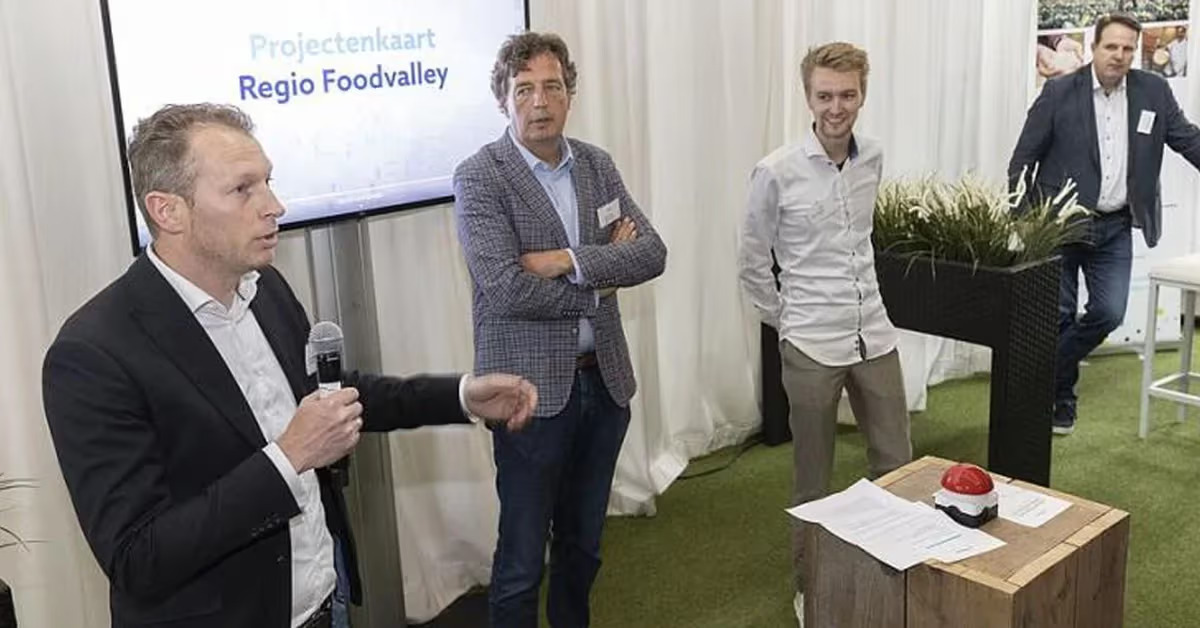
Regio Foodvalley used GeoApps to create a digital project map that brings together initiatives from across its regional programme. The map gives businesses, residents, students and public organisations a clearer overview of active projects and makes it easier to find relevant contacts.
More importantly, the project demonstrates how a regional strategy can be translated into an accessible spatial overview. Instead of leaving programmes scattered across separate sources, the map provides one place where users can explore what is happening and understand how projects relate to the region as a whole. Although the example comes from Foodvalley, the underlying approach is broadly applicable to any region managing multiple sustainability initiatives and stakeholder groups.
Keep the Overview Current as Projects Change
Regional sustainability programmes continue to evolve over time. New projects begin, priorities shift and existing initiatives move into different phases, so a useful regional overview needs to remain easy to maintain.
With GeoApps, authorised users can update project information and keep the map aligned with current developments. Therefore, the platform can grow alongside the regional programme instead of becoming a static snapshot. A current overview also makes communication more reliable because stakeholders can see which projects are active, where developments are taking place and how the regional portfolio changes over time.
From Scattered Projects to Coordinated Regional Action
Ultimately, the value of a regional sustainability map is not simply that it displays projects. Its real value lies in making initiatives easier to discover, compare and connect.
By bringing projects, locations, themes and stakeholders together in one interactive environment, regions can create greater visibility around what is already happening and make collaboration easier to organise. As a result, a collection of separate initiatives can become a more connected regional programme, while spatial insight provides a practical way to turn strategy into a shared and understandable picture of action.
Ready to Create a Clearer Regional Overview?