How Online Maps Strengthen Ecological Consultancy and Biodiversity Planning
Ecological projects increasingly require teams to combine many different types of information. Habitat conditions, biodiversity observations, land ownership, historical maps, field surveys and stakeholder knowledge may all influence recommendations. However, when this information remains scattered across separate files, reports and systems, understanding how everything relates geographically becomes difficult.
Online maps provide a shared spatial context for this information. Ecological consultants can connect observations and analysis directly to locations, while clients, landowners and other stakeholders can explore the same information without needing specialist GIS knowledge. As a result, complex ecological questions become easier to analyse, communicate and translate into practical recommendations.
Connect Ecological Data to the Places It Describes
Ecological assessments depend heavily on location. A habitat type, ecological corridor or biodiversity opportunity only becomes meaningful when teams understand where it occurs and how it relates to the surrounding landscape.
Therefore, online maps help consultants bring different datasets together in one geographic environment. Teams can combine field observations, vegetation data, elevation information, historical maps and other relevant sources to understand how ecological conditions vary across an area.
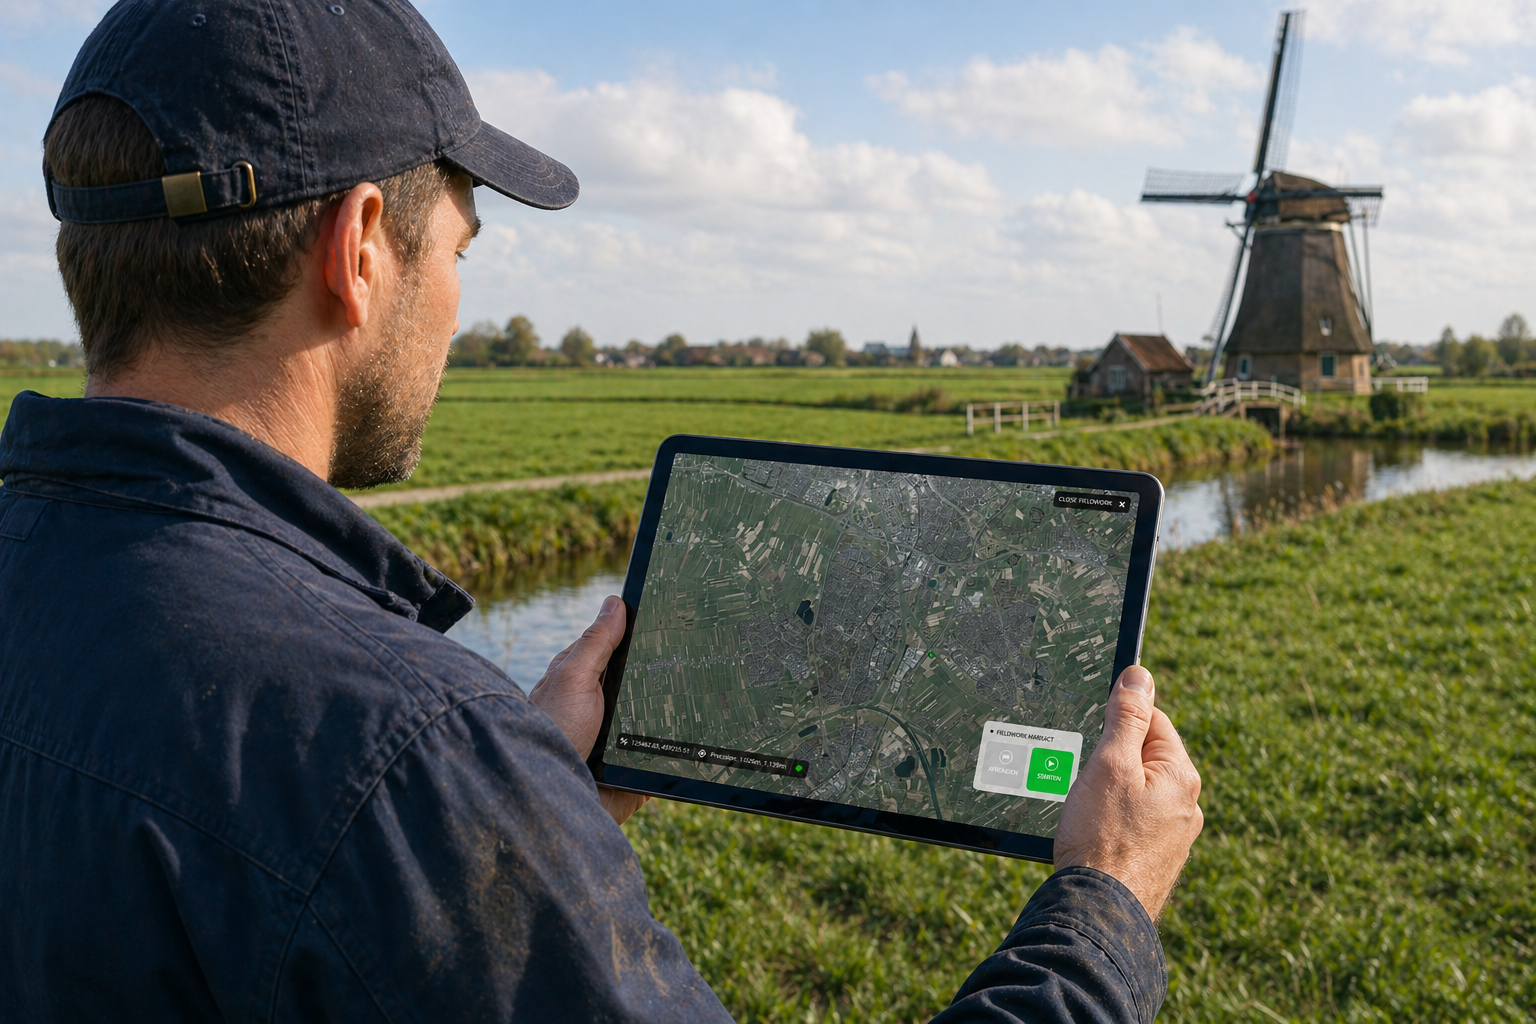
This spatial overview can help identify:
opportunities to connect fragmented habitats
areas with biodiversity potential
ecological relationships between neighbouring parcels
locations requiring further field investigation
possible conflicts between development and nature
areas where restoration measures could have the greatest value
Instead of evaluating each dataset separately, consultants can analyse how environmental factors interact across the landscape.
Make Stakeholder Knowledge Part of the Analysis
Technical ecological data provides an important foundation, but local stakeholders often hold information that is difficult to capture through datasets alone. Landowners, residents, conservation organisations and local experts may understand how an area changes throughout the year, where particular species are observed or which locations face practical management challenges.
With MapTalk, this knowledge can be collected geographically. Participants can respond directly on an interactive map, allowing comments and observations to be connected to specific locations rather than submitted as disconnected text.
Consequently, consultants gain additional spatial context while stakeholders can participate in a more concrete way. Instead of discussing an entire area in general terms, everyone can refer to the same parcel, route or ecological feature.
Turn Complex Ecological Analysis into Clear Recommendations
Ecological studies often involve a large amount of specialist information. While this detail is essential for consultants, it can be difficult for policymakers, project managers or landowners to interpret.
Interactive maps help translate detailed ecological analysis into a clearer visual overview. Different habitats, opportunities, constraints and recommendations can be displayed as map layers so users can understand how they relate geographically.
For example, consultants can show where habitat connections could be strengthened, which parcels may support particular ecological objectives and where management measures could contribute to biodiversity. This makes recommendations easier to explore and provides a stronger spatial basis for discussion.
Use the Right Map for Each Stage of the Project
Ecological projects rarely involve only one type of map. During the research phase, specialists may need detailed datasets and technical layers. During stakeholder engagement, participants need a simpler environment where they can contribute without GIS expertise. Later, decision-makers may need a clear overview of recommendations and priorities.
GeoApps supports this by allowing organisations to create applications around different workflows and audiences. Together with MapTalk and map-based storytelling or presentation tools, project teams can provide the right level of information for each stage.
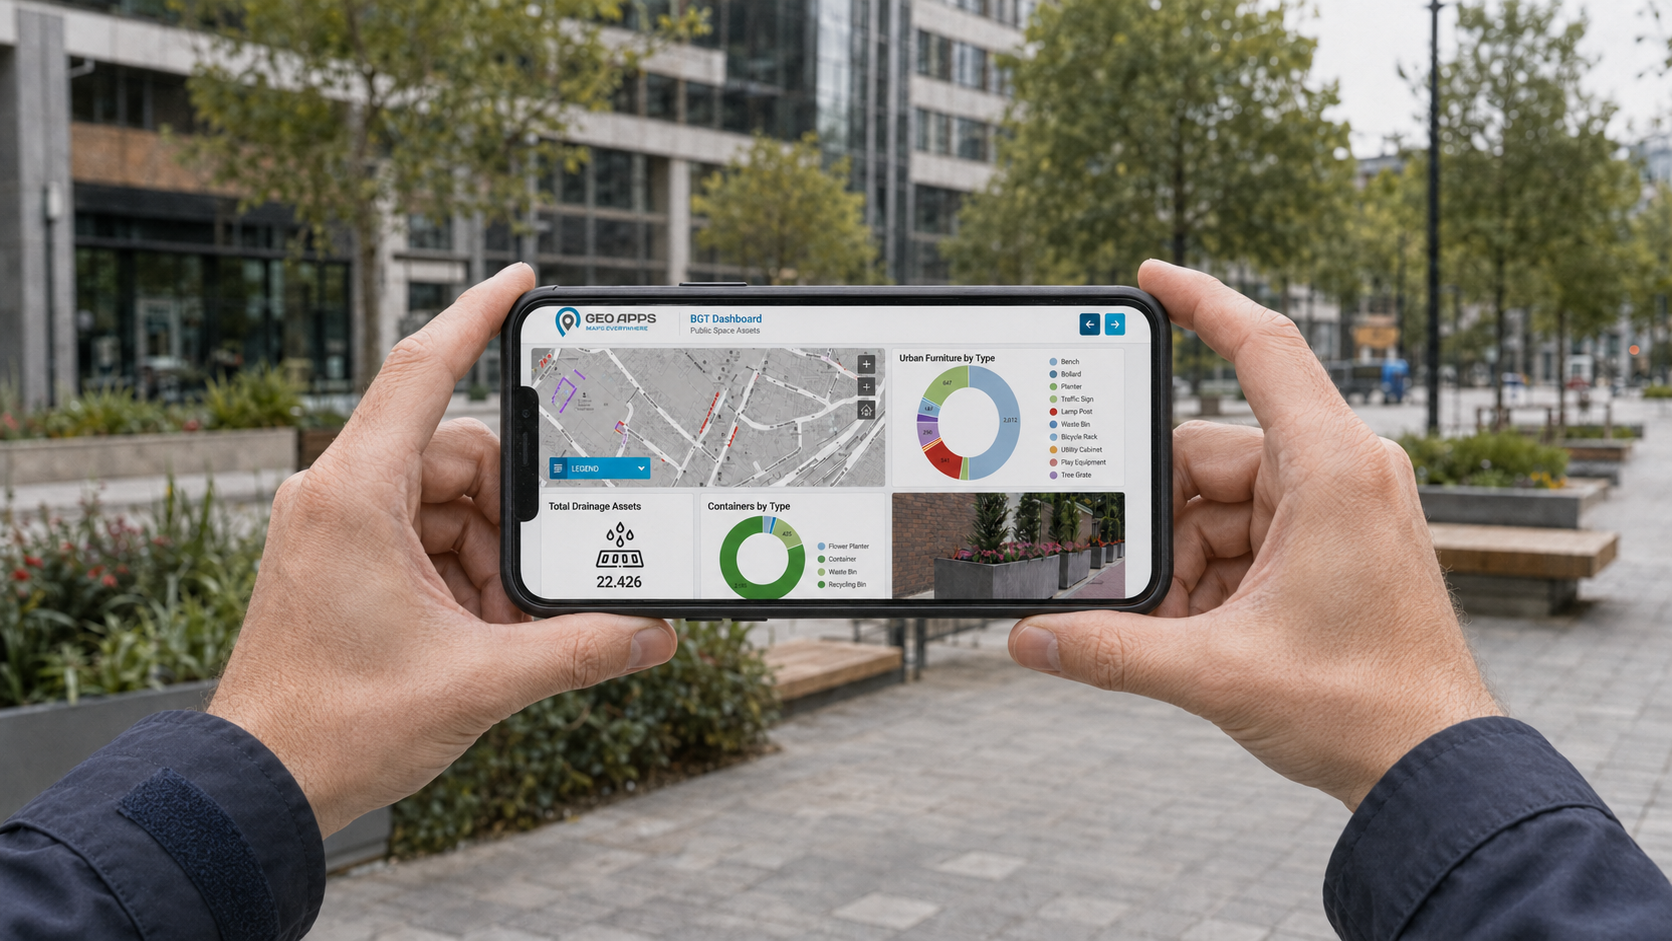
For example:
specialists can analyse detailed ecological and environmental datasets
stakeholders can contribute location-based knowledge through MapTalk
project teams can present recommendations through accessible interactive maps
decision-makers can compare opportunities and priorities geographically
In this way, the underlying spatial information can remain connected while the user experience is adapted to each audience.
Improve Collaboration Across Project Teams
Ecological consultancy often involves collaboration between consultants, public organisations, landowners, researchers and environmental specialists. Each party may bring different expertise and information to the project.
A shared online map provides a common visual reference. Rather than exchanging separate map exports, spreadsheets and reports, teams can discuss the same locations and spatial information within one environment. Moreover, updates can be made available more consistently, which helps reduce confusion about which information is current.
This supports clearer communication between technical specialists and non-specialist stakeholders while keeping geography at the centre of the conversation.
Support Biodiversity Planning at Landscape Scale
Biodiversity challenges rarely stop at administrative or property boundaries. Habitats depend on connections between areas, while fragmentation can reduce ecological quality even when individual sites are well managed.
For that reason, landscape-scale analysis is particularly valuable. By visualising ecological conditions across larger areas, consultants can identify relationships that may not be visible when individual parcels are assessed separately.
Online maps can help teams examine habitat connectivity, biodiversity opportunities, ecological corridors and management differences across an entire project area. As a result, recommendations can consider how interventions at one location contribute to a wider ecological network.
A Practical Example from Ecological Consultancy
In a large-scale nature development project, an ecological consultancy used online mapping tools to combine specialist analysis with stakeholder knowledge across hundreds of parcels. Location-based participation allowed landowners and other stakeholders to contribute observations and ideas directly on the map, while ecological specialists used spatial data to assess opportunities for strengthening habitats and biodiversity.
The project demonstrated the value of using different map applications throughout the workflow. Detailed ecological analysis supported specialist work, location-based participation captured local knowledge and accessible online maps helped communicate recommendations to a broader audience.
Although every ecological project is different, the principle is widely applicable: connecting professional analysis, stakeholder knowledge and geography creates a stronger foundation for environmental decision-making.
Make Ecological Insight Easier to Use
The value of ecological data depends on how effectively it can support decisions. A technically detailed analysis may be scientifically strong, but its impact remains limited when clients and stakeholders struggle to understand or apply the results.
By presenting ecological information spatially, consultants can make complex findings easier to explore and explain. In addition, location-based collaboration helps teams connect field knowledge, technical analysis and stakeholder perspectives without losing the geographic context behind them.
Ultimately, online maps help move ecological consultancy from separate datasets and reports toward a more connected workflow where analysis, participation and communication reinforce one another.
Ready to Make Ecological Projects More Spatially Connected?