Municipality of Gennep chooses ESG Maps to steer home insulation
Gennep, on the Meuse, needed a tool that both shows and steers home insulation: opportunities per building and neighbourhood, energy labels, the local insulation programme, and progress down to each home.
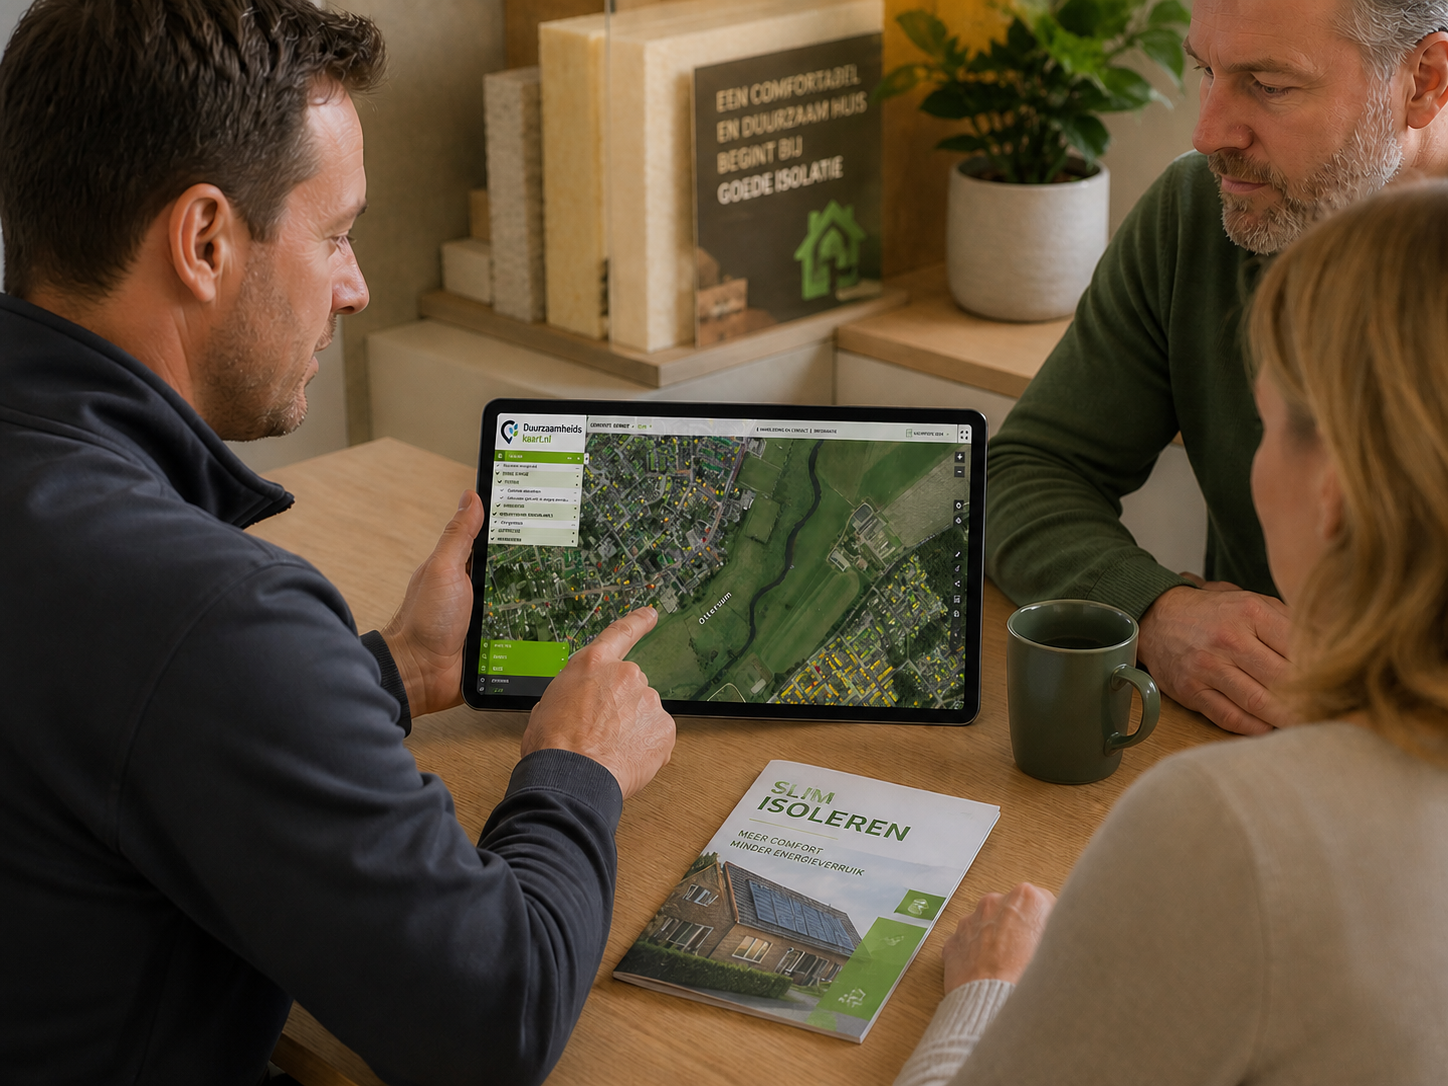
The municipality of Gennep, beautifully situated on the Meuse, is investing heavily in making homes more energy-efficient. To turn that ambition into action it looked for a tool that could support the process. With ESG Maps, Gennep now has a way to make insulation visible and to steer it: insight into opportunities for housing improvement, and a place to record progress.
Housing improvement you can follow
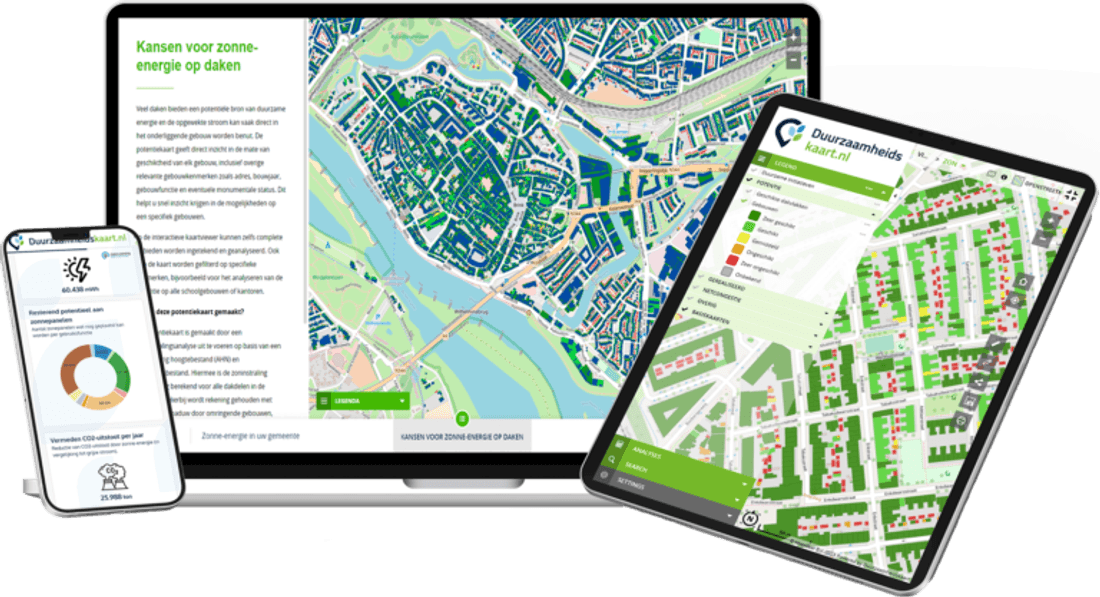
Gennep focuses on improving the energy efficiency of homes. A key wish is to get a firmer grip on the housing stock and how far insulation has already come. ESG Maps shows energy labels, building characteristics and tenure per building and neighbourhood — municipal property, housing-association stock and owner-occupied homes. That matters, because each type of home needs a different approach and different support. The map works at several scales, from the municipal total down to a single dwelling.
Neighbourhood insight
By combining dwelling data and aggregating it to neighbourhoods, Gennep can see quickly which area lags furthest on registered energy labels. The map can also be coloured by socio-demographic characteristics, so neighbourhoods with energy poverty stand out. Those areas often need targeted programmes for support and information for owners.
Fit with the local insulation programme (LAI)
The Dutch ‘Lokale Aanpak Isolatie’ subsidy lets a municipality run its own insulation programme for poorly insulated owner-occupied homes, including owners’ associations that struggle to get started. ESG Maps fits that work. The energy-label module gives a deep view per home and neighbourhood, including how many steps remain to reach label B, so the municipality can plan support where it helps most.
A progress layer records housing improvement per dwelling, so the municipality keeps grip on the approach and can steer when needed.
Dashboard
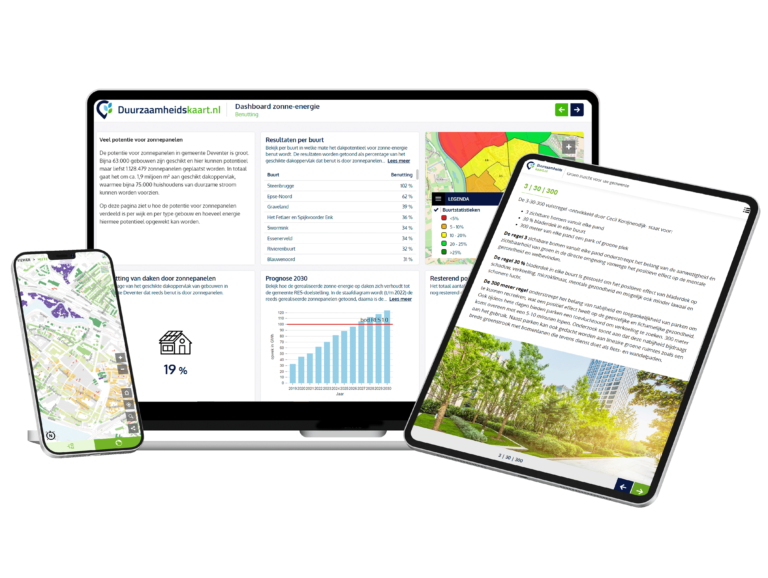
A usable dashboard tracks neighbourhood progress at any moment and is easy to share with colleagues and the executive. Together these tools give Gennep a way to work more effectively toward a more sustainable municipality.
Ready to work after a short briefing
While we configure the map for Gennep, a digital user briefing follows so the municipal team can work independently. Then Gennep can take concrete steps — with the handles to act first where it is needed most.
Contact
Want to know more?
Questions about our products? Looking for a demo or quote? Fill in the form and we will get back to you.
Fill out the form and we will contact you within 24 hours, or book .