“Developers invest a lot in greening, but it was hard to see what that actually delivered overall. With the new analysis we could draw up a concrete green balance for the first time.”
Green-roof potential for residents and policy
The green roof map helps Dutch municipalities and water authorities show residents whether a roof suits extensive (sedum) or intensive greening — and put that next to solar and other roof layers.
More information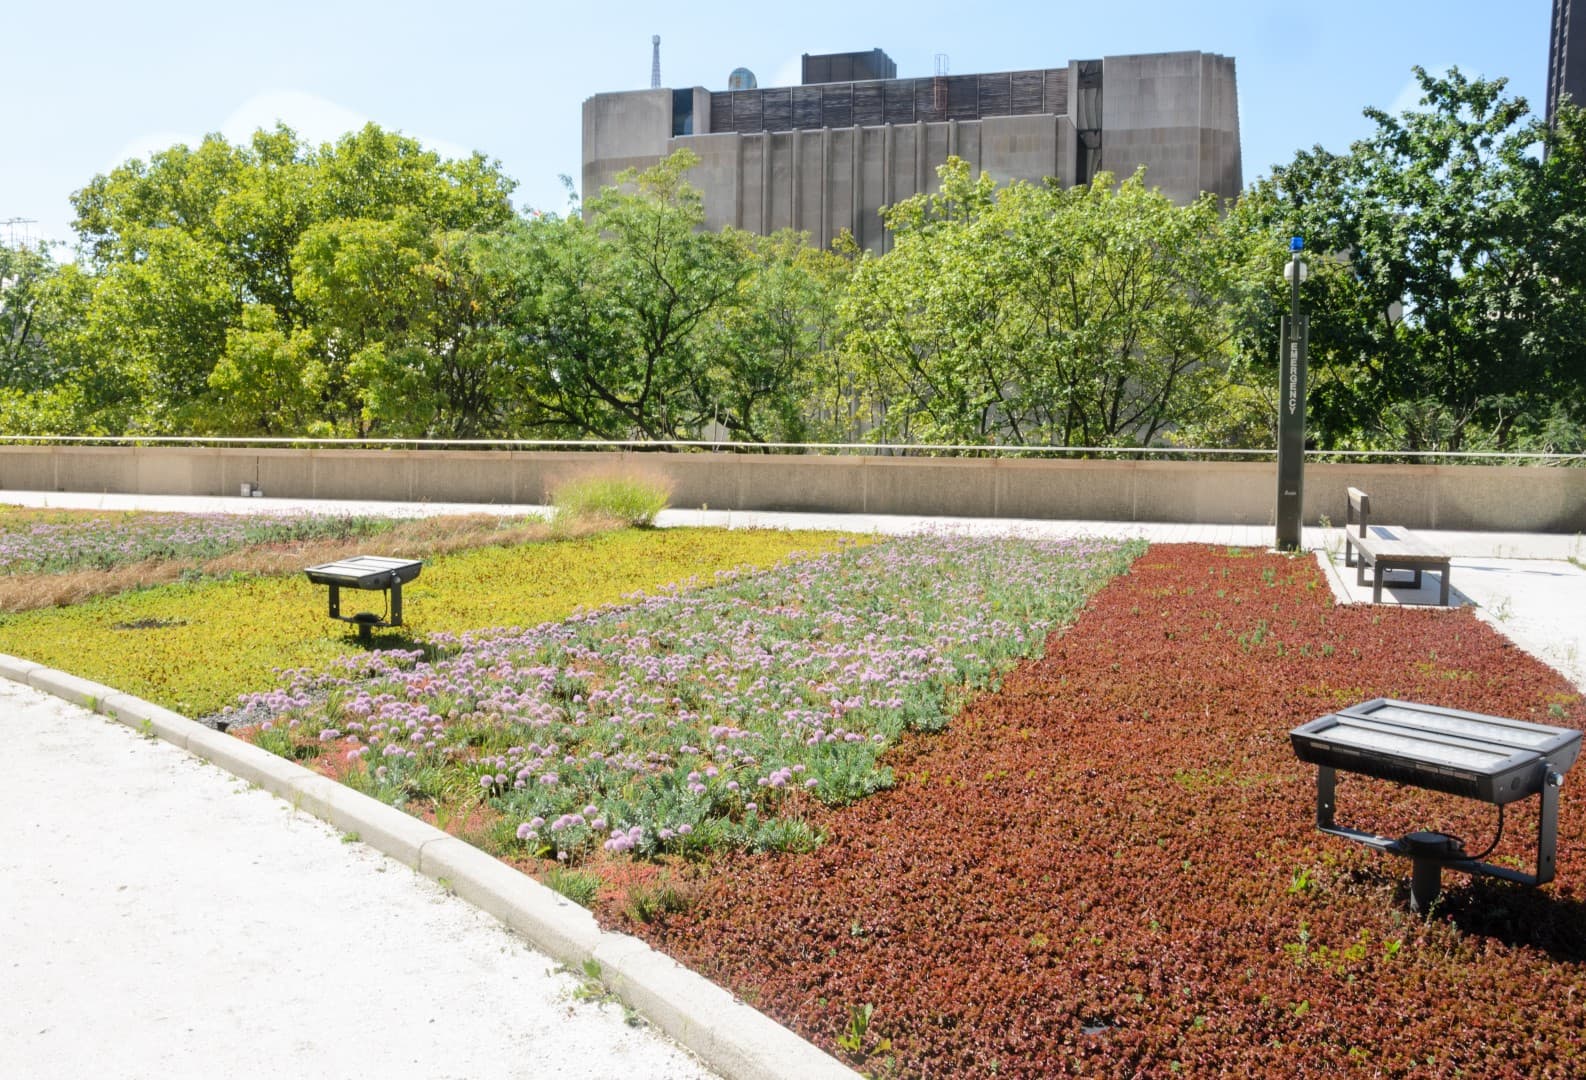
Trusted by municipalities, provinces and organisations in the Netherlands and Belgium







































Green roofs can hold rainwater, add vegetation in dense neighbourhoods and last longer than a bare covering. Residents often do not know what their roof can carry. A public map lowers that barrier without pretending every roof is a garden.
Water
Retention on the roof
Living environment
More green in the city
Roof types
Sedum to roof garden
Policy
Greening you can show
Residents enter an address and see an indication of roof suitability and which type of green roof may fit. Municipalities and water authorities use the same picture for communication and, where they offer a scheme, to point people to subsidy information — the map does not replace a structural survey.
Show potential per roof surface, explain extensive versus intensive, and keep solar and asbestos layers in the same platform so roof choices are not three separate websites.
Practice example · Leiden
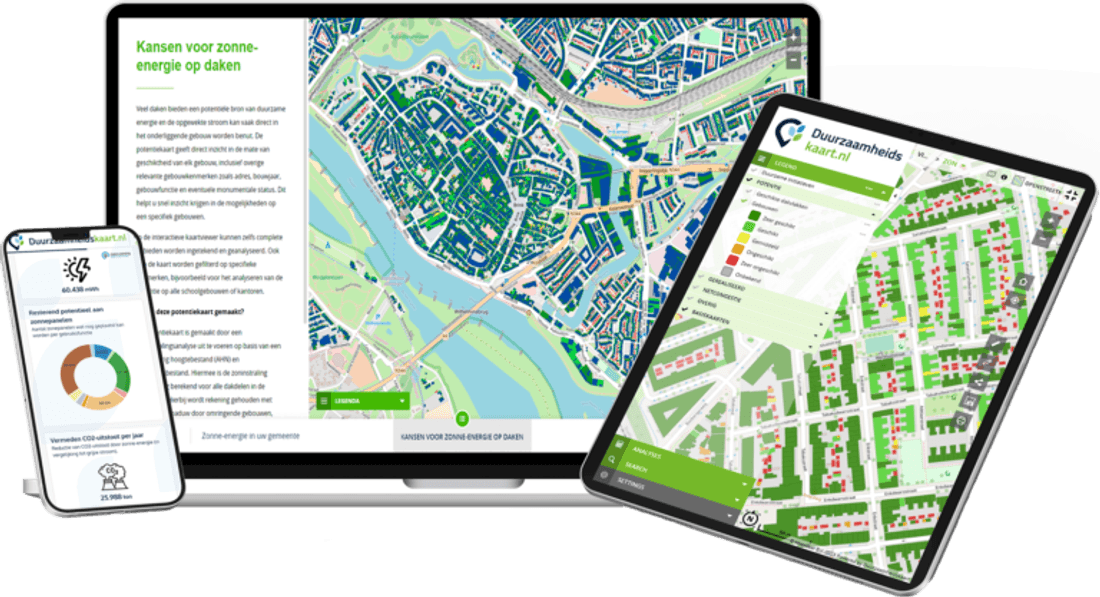
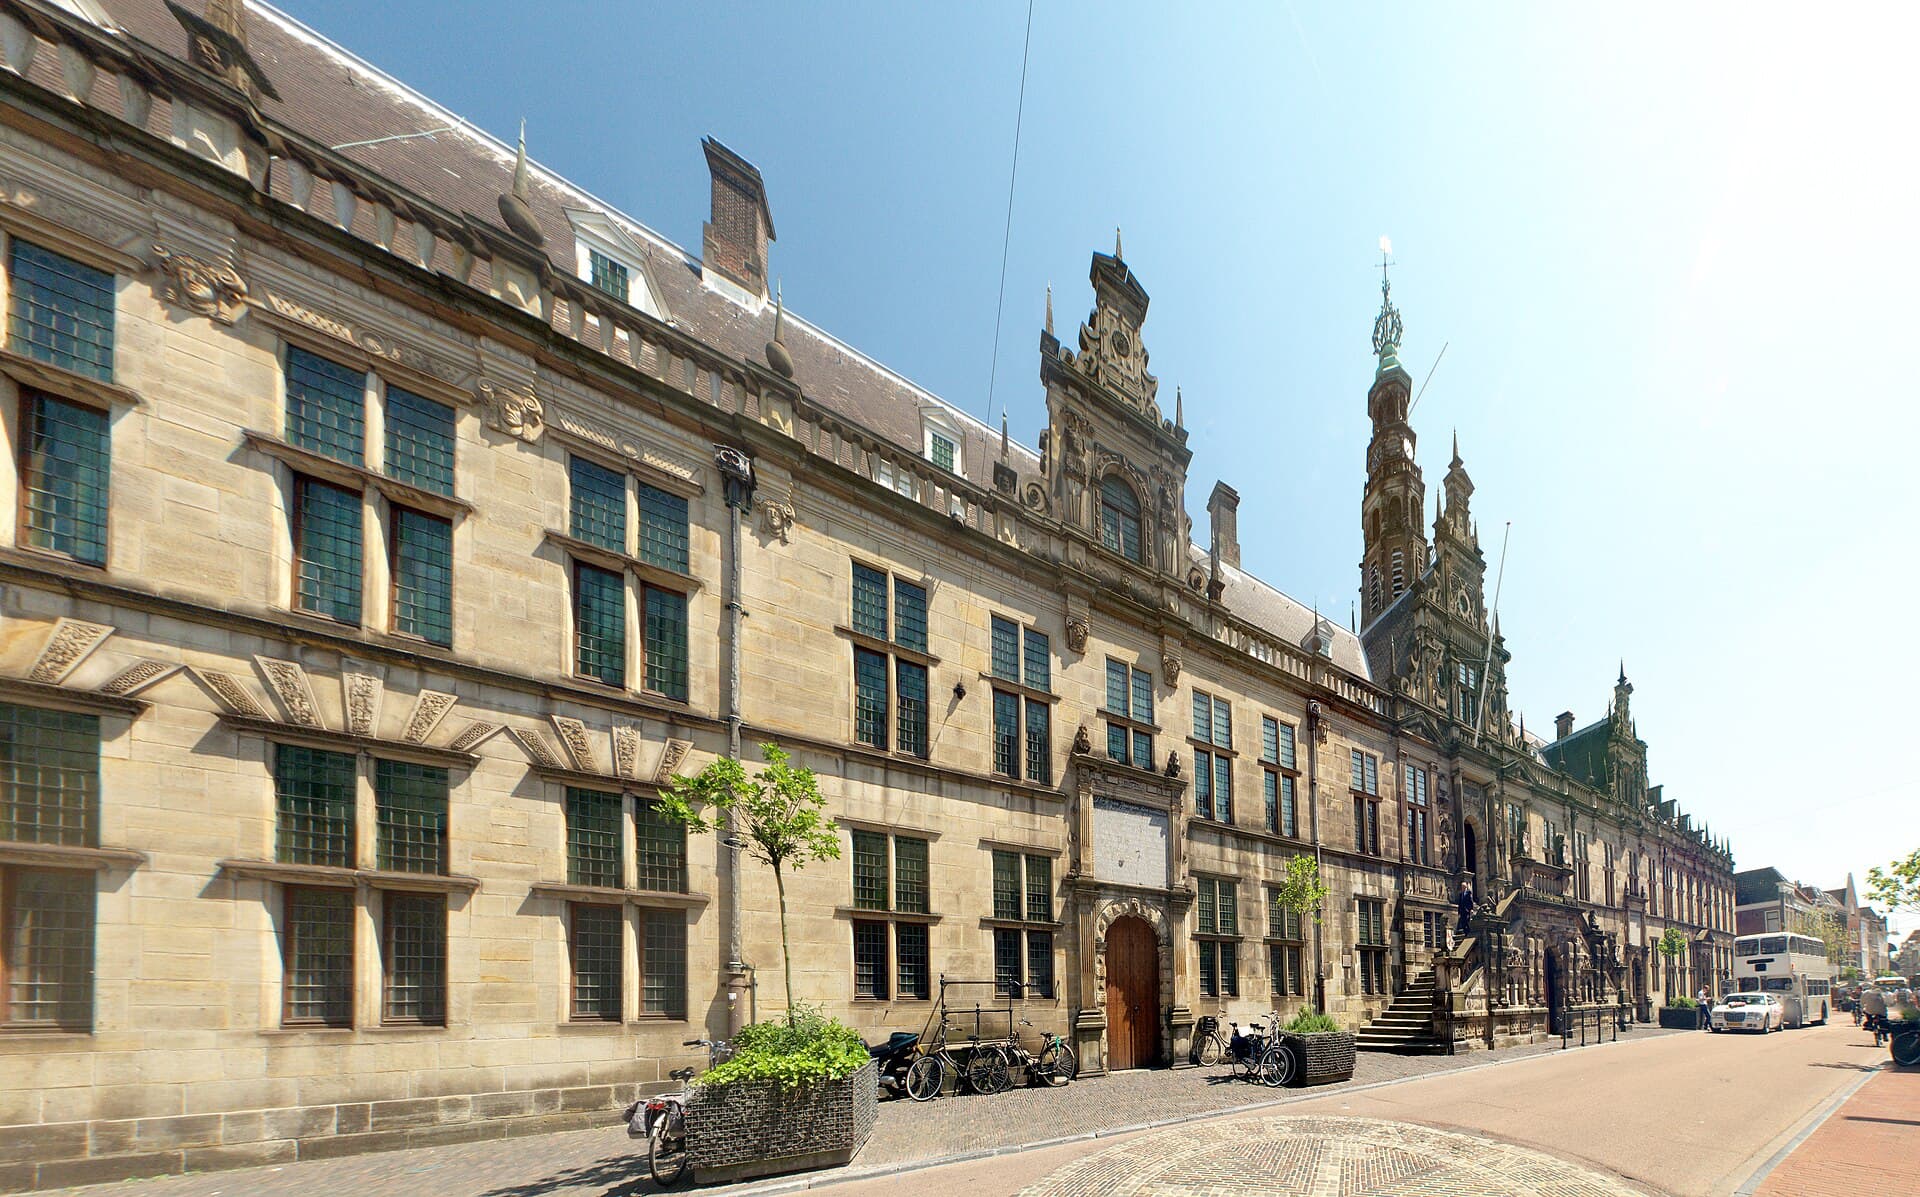
The Dutch municipality of Leiden wanted one public map for sustainable roof choices. Residents can explore solar-on-roof and, in the same environment, see opportunities for green roofs — instead of scattered datasets for policy and citizens.
Read the Leiden caseLeiden put green roofs next to solar for residents
01 / 02
One municipality, one public map
Leiden brought solar, green roofs and spatial insight together for residents and policymakers.
Green roofs contribute to rainwater retention and a greener living environment. The map shows what may be possible; design and construction still need a roof specialist.
Lightweight vegetation such as sedum, herbs, moss and grass. Typically used where load-bearing capacity is limited.
A heavier roof garden with shrubs or trees, walkable as outdoor space. Needs a stronger structure and more maintenance.
Substrate and roots can hold rain and release it more slowly, which can ease pressure on sewers during heavy showers.
A typical build-up includes waterproofing, protection, drainage, filter, substrate and vegetation. Systems differ; the map is an indication, not a construction drawing.
A public or policy map of green-roof potential. Not an automatic subsidy application and not a guaranteed euro saving per roof.
Per address or roof plane: an indication whether greening may be possible and which type fits.
Use the map in talks about pluvial flooding and neighbourhood greening.
Point residents to municipal or water-board information where you offer a subsidy. Applications stay with the scheme.
Green roofs sit next to the solar map and asbestos roof map in ESG Maps.
Current page
The green roof map is part of the ESG Maps platform. View green-roof potential alongside solar energy, asbestos roofs and other sustainability data.
Green roof map
Experiences from organisations working with ESG Maps.
“Developers invest a lot in greening, but it was hard to see what that actually delivered overall. With the new analysis we could draw up a concrete green balance for the first time.”
“Calculations that used to take us a week are now done in minutes. That saves us a huge amount of time and money.”

“We present our expertise as interactive map applications, not dry reports. Colleagues without technical knowledge can use them too - ESG-Maps is an essential foundation for policy-making.”
“ESG-Maps has helped us make sustainability data accessible to everyone. The platform combines powerful visualisation with an easy user experience.”
“Together with MapGear (ESG-Maps) we built a realistic solar potential forecast for Groningen in 2035 - combining data on roofs, heat pumps, electric driving and policy choices.”

“Together with MapGear (ESG-Maps) we developed the TransitiePlanner for energy, climate adaptation and mobility. We are building a dynamic dossier for sustainable business parks.”

“ESG-Maps has helped us plan and deliver our energy transition projects more efficiently.”
“With Asbestdakenkaart we finally have an overview of our asbestos data and remediation progress. One place to prioritise, monitor and report.”
“Developers invest a lot in greening, but it was hard to see what that actually delivered overall. With the new analysis we could draw up a concrete green balance for the first time.”
“Calculations that used to take us a week are now done in minutes. That saves us a huge amount of time and money.”
“We present our expertise as interactive map applications, not dry reports. Colleagues without technical knowledge can use them too - ESG-Maps is an essential foundation for policy-making.”
“ESG-Maps has helped us make sustainability data accessible to everyone. The platform combines powerful visualisation with an easy user experience.”
“Together with MapGear (ESG-Maps) we built a realistic solar potential forecast for Groningen in 2035 - combining data on roofs, heat pumps, electric driving and policy choices.”
“Together with MapGear (ESG-Maps) we developed the TransitiePlanner for energy, climate adaptation and mobility. We are building a dynamic dossier for sustainable business parks.”
“ESG-Maps has helped us plan and deliver our energy transition projects more efficiently.”
“With Asbestdakenkaart we finally have an overview of our asbestos data and remediation progress. One place to prioritise, monitor and report.”
Request a demo and show residents which type of green roof may fit their address.
Answers about the green roof map.
Extensive usually means lightweight vegetation (sedum, herbs, moss, grass). Intensive means a heavier, walkable roof garden. The map indicates which type may be possible; a specialist still checks structure and detailing.
Some Dutch municipalities and water boards offer schemes. The map can point to information you configure. Check current conditions with the municipality or water board — the map does not award subsidy.
We combine roof planes, pitch and other available building information. The result is an indication, not a construction advice.
Yes. On ESG Maps you can use the green roof map together with solar and asbestos roof layers so residents and policy see roof options in one place. Leiden is an example of that combined public map.
Contact
Questions about our products? Looking for a demo or quote? Fill in the form and we will get back to you.
Fill out the form and we will contact you within 24 hours, or book .