A health centre is only a few kilometres away. A school appears close to a residential neighbourhood. A proposed service point looks centrally located. Yet the journey can tell a different story.
Road layouts, river crossings and transport options influence how easily people can reach a location. Consequently, distance alone leaves important questions unanswered when organisations assess sites or review service coverage.
The travel-time and catchment-area tools from MapServices help teams investigate those questions. By exploring journeys and reachable areas, organisations can compare locations with greater spatial context and make the assumptions behind their decisions easier to discuss.
A nearby service can still be difficult to reach
Straight-line distance provides a starting point, but it does not describe the route someone must take. Two neighbourhoods equally far from a facility can have different journey times because of the transport network between them.
For example, one may have a direct connection while another requires a detour. Similarly, a location that is accessible by car may be harder to reach on foot or by bicycle. Therefore, the analysis should begin with the people who need the service and their available transport options.
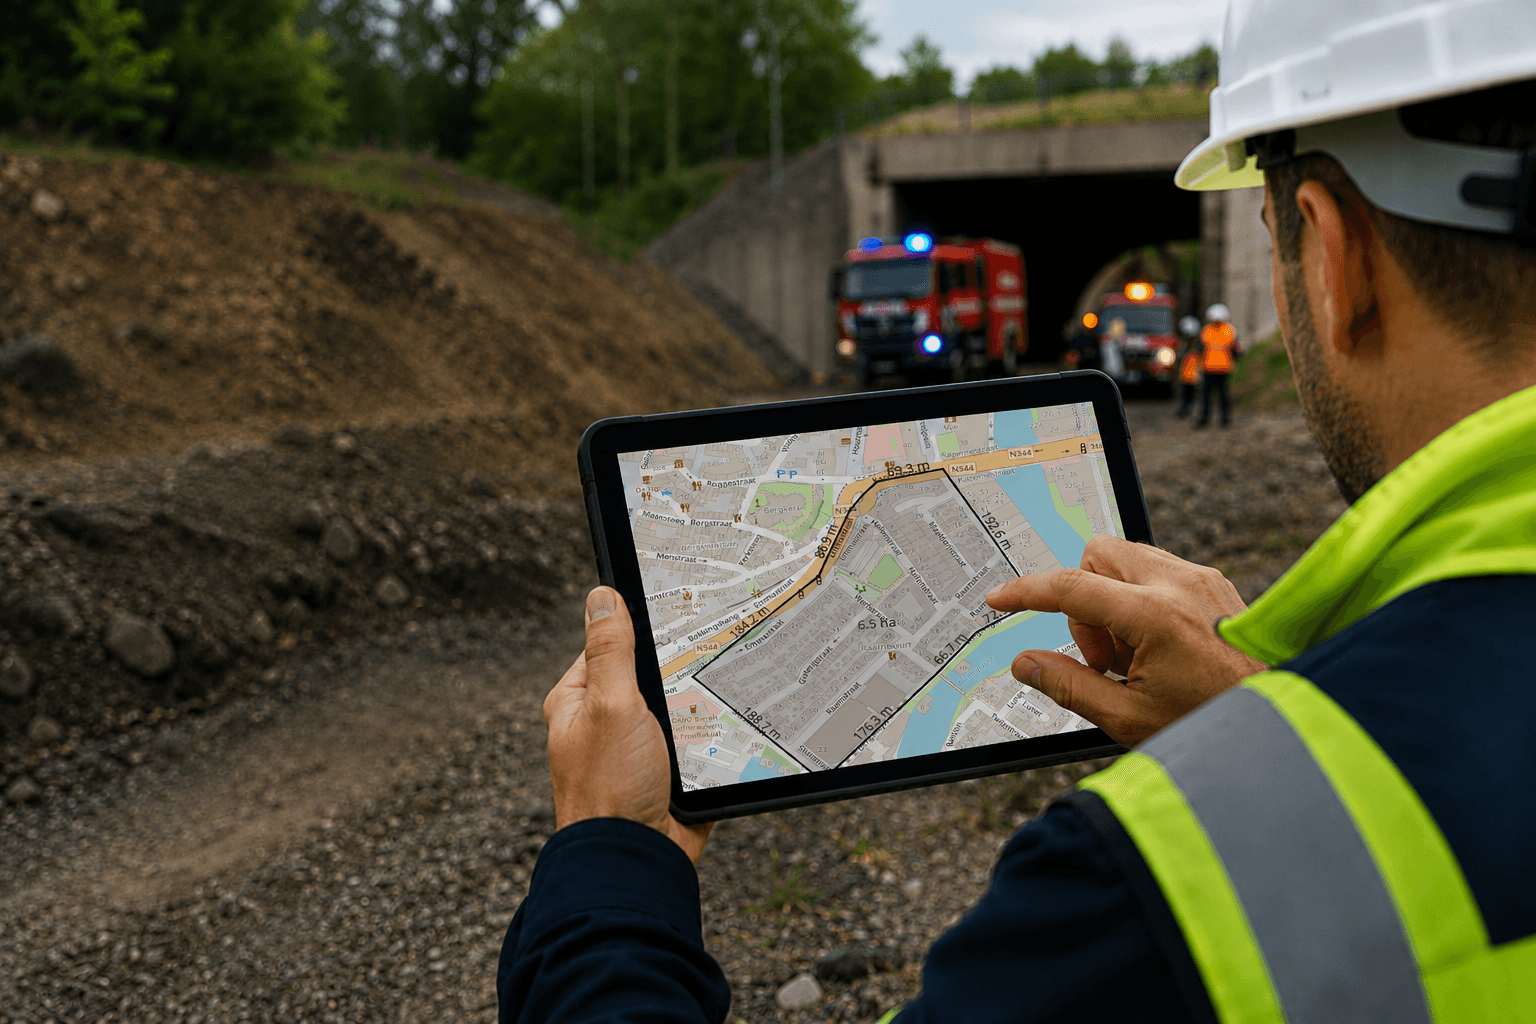
MapServices offers travel-time tools for investigating journeys between locations. Its catchment-area tool explores which areas can be reached within a selected time threshold. These areas are known as isochrones.
An isochrone follows the transport network rather than forming a simple circle around a site. However, it remains a modelled result. The selected travel mode, routing data and calculation settings all affect the boundary shown on the map.
Find the communities a broad overview can overlook
Knowing how many facilities an area contains does not explain how easily residents can reach them. Several locations may serve overlapping areas while other neighbourhoods face longer journeys.
Catchment-area analysis with MapServices provides a starting point for examining this distribution. By exploring the reachable areas around existing facilities, teams can investigate where coverage overlaps and where gaps may exist under the chosen travel-time threshold.
Where suitable data is available, GIS teams can assess these results alongside population distribution, neighbourhood boundaries or other relevant information. This helps connect the analysis to a practical question: does the location serve the communities it is intended to reach?
Nevertheless, travel time is only one part of accessibility. Opening hours, capacity, affordability and physical access also influence whether people can use a service. MapServices helps investigate the geographic component, which should be considered alongside these other factors.
Compare locations before committing to a site
A centrally positioned site can seem like an obvious choice. Yet its practical value depends on how it connects to the people and places it needs to serve.
MapServices includes site location analysis tools for comparing travel times between origin locations and potential sites. This supports questions such as which candidate offers shorter journeys from selected neighbourhoods or how accessibility differs across the people being served.
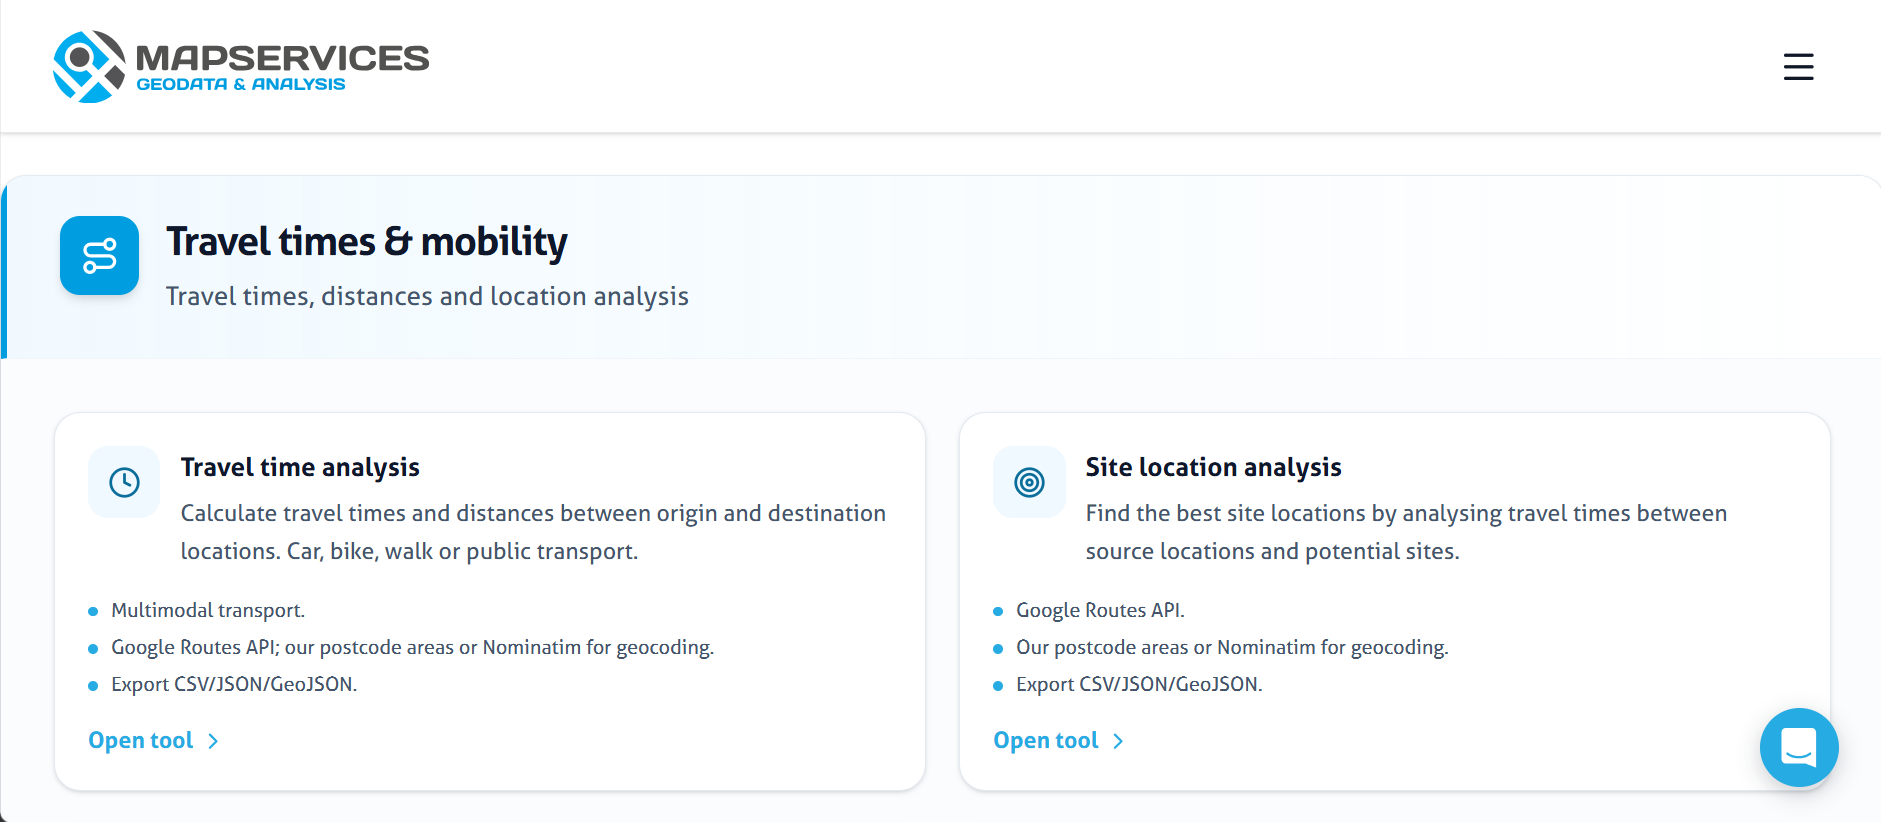
Meanwhile, catchment-area analysis offers a complementary perspective: which areas can be reached within a chosen journey time from each candidate? Together, these approaches help teams examine both individual journeys and wider geographic coverage.
For a meaningful comparison, keep the travel mode and calculation settings consistent. Also consider journey direction, since travelling to a facility can differ from travelling away from it where network restrictions apply.
Furthermore, testing several time thresholds can reveal trade-offs. A location may cover a wide area within thirty minutes but serve fewer people within ten minutes. These findings should then be considered alongside suitability, cost, capacity and operational requirements.
Turn a MapServices analysis into a useful planning conversation
The value of an analysis comes from the questions it helps answer. A coloured boundary or travel-time figure becomes more useful when colleagues understand how it was calculated and what it means for the project.
The MapServices travel-time and mobility tools provide a practical starting point for exploring accessibility. Teams can investigate journeys, compare candidate locations and examine catchment areas before deciding which questions need more detailed analysis.
For organisations using GeoApps, suitable outputs can also be presented alongside relevant spatial information, depending on the available data and application configuration. Facility locations, neighbourhood boundaries and population data can give colleagues additional context for discussing coverage.
Before sharing results, document the travel mode, time threshold, data source and relevant settings. Explain any limitations that could influence interpretation, such as missing local connections or temporary network changes.
Finally, use the findings to guide discussion. Which communities appear underserved? Which assumptions need testing? Where would another facility make the most meaningful difference? MapServices helps make these questions more concrete, while GIS expertise supports their interpretation.
Explore who your locations can reach
Are you reviewing service coverage or comparing potential sites? Start with a clear question about the people, journeys and facilities that matter.
Explore the MapServices travel-time and mobility tools to investigate accessibility and location options.
Would you like to discuss presenting spatial analyses within your GeoApps environment? Contact the GeoApps team.