Skip to main contentSkip to navigation
ExploreJobsAbout usContact
Log in
MapGear Logo
JobsNewsAbout MapGear
Log inContact
MapGear, known through GeoAppsGeoApps
GeoApps Logo
Apps
Solutions
Platform
About us
Get advice
GeoApps Logo

GeoApps is the leading software platform for GIS applications and spatial data, enabling organizations to make data-driven decisions.

Solutions

  • Urban Planning
  • Infrastructure
  • Real Estate
  • Environment & Climate
  • Energy Transition
  • Safety & Risk

Products

  • GeoApps
  • Solutions
  • ESG-Maps
  • MapServices
  • TouchTable
  • Consultation

Apps

  • Viewer
  • Dashboard
  • Fieldwork
  • MapTour
  • MapTalk
  • Custom

For whom?

  • Municipalities
  • Provinces
  • Environmental Services
  • Engineering
  • Contractors
  • Safety Regions

Platform

  • Integrations
  • Documentation
  • GIS Lexicon
  • System Status
  • Changelog
  • Support
  • Subscriptions

Company

  • About Us
  • Careers
  • Contact
  • Partners
  • News & Blog
  • Events

Stay up-to-date

Subscribe to our newsletter to get the latest updates on our products and services. You can unsubscribe at any time.

Keep an eye on our socials too

Stay connected with us through our social media channels and get the latest updates on our products and services.

Quality & trust

MapGear is ISO 9001 and ISO 27001 certified and meets the highest quality and security standards for our products and services.

ISO 9001 Certificering
ISO 27001 Certificering
QGIS Membership 2026
© 2026 MapGear B.V. All rights reserved.
Terms & conditionsPrivacy PolicySustainability statement
CBAM 2026 Requires Better Emissions and Location Data | GeoApps Blog
Featured image for CBAM 2026: Why Location and Material Data Are Becoming Increasingly Important for CO₂ Reporting
View All Posts
📸 Featured
News

CBAM 2026: Why Location and Material Data Are Becoming Increasingly Important for CO₂ Reporting

From January 1, 2026, the Carbon Border Adjustment Mechanism (CBAM) will be fully implemented within the European Union. For many organizations, this means stricter requirements for CO₂ transparency and reporting.

January 5, 2026
Duurzaamheidskaart
2 min

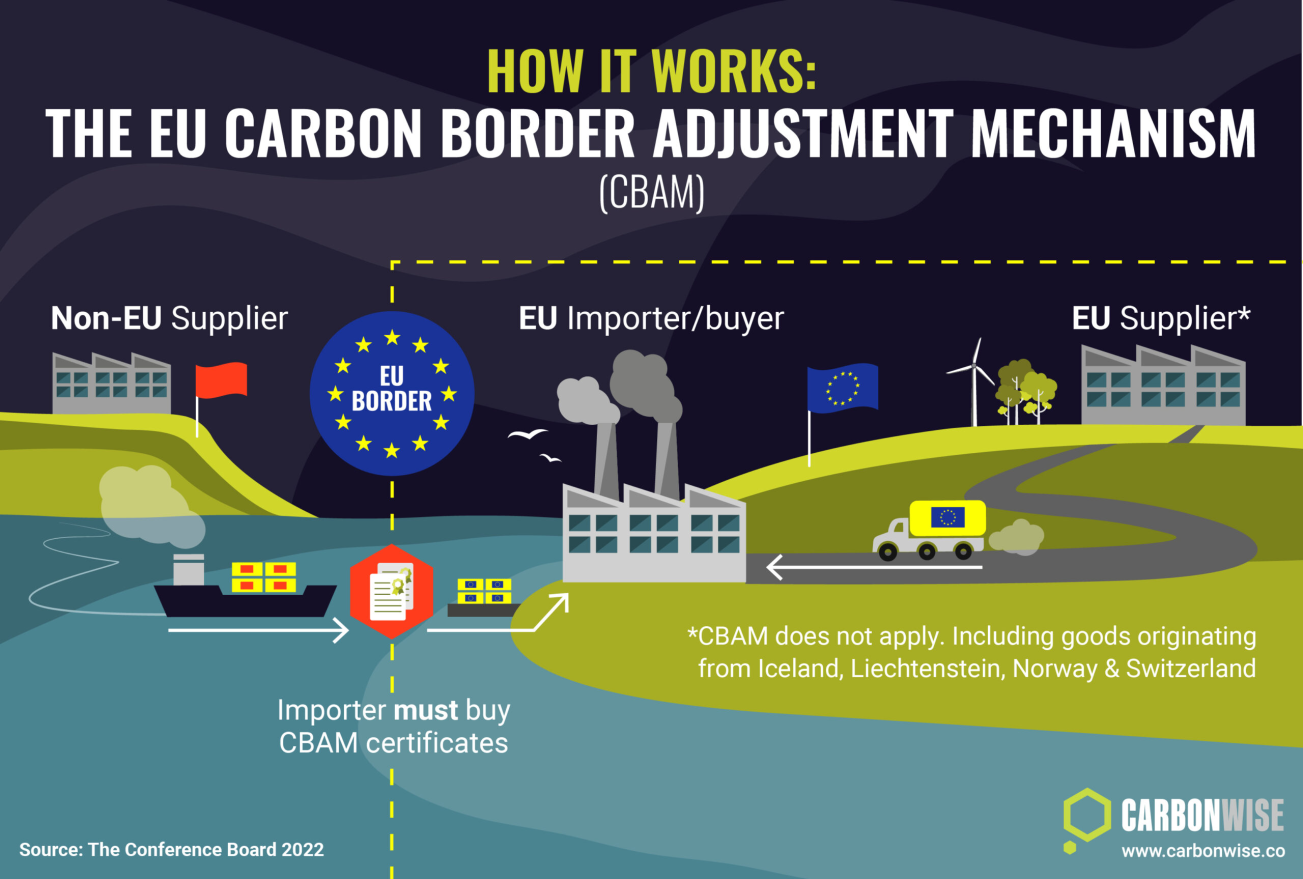
CBAM exposes a growing challenge around emissions visibility and accountability

Starting in 2026, CBAM moves beyond transitional reporting into stricter compliance requirements. Organizations importing specific goods into the European Union will increasingly need to demonstrate where emissions originate, how materials are used and how sustainability claims are substantiated.

That shift creates a broader challenge than reporting alone. Many organizations still rely on averages, fragmented datasets and assumptions that are becoming harder to defend in a context where transparency, traceability and accountability are increasingly important.

CBAM therefore does not only increase pressure on sustainability reporting. It exposes how limited visibility many organizations still have into emissions, production locations, material usage and supply chain impact.

Location and material data are becoming essential for defensible reporting

CO₂ emissions are never isolated. They are always connected to specific materials, production methods, energy sources and geographic locations. The same material can have a completely different emissions profile depending on where and how it is produced.

That is why averages alone are often insufficient. Organizations increasingly need location-specific insight to understand where emissions occur, how material choices influence sustainability impact and how performance differs between projects, suppliers or regions.

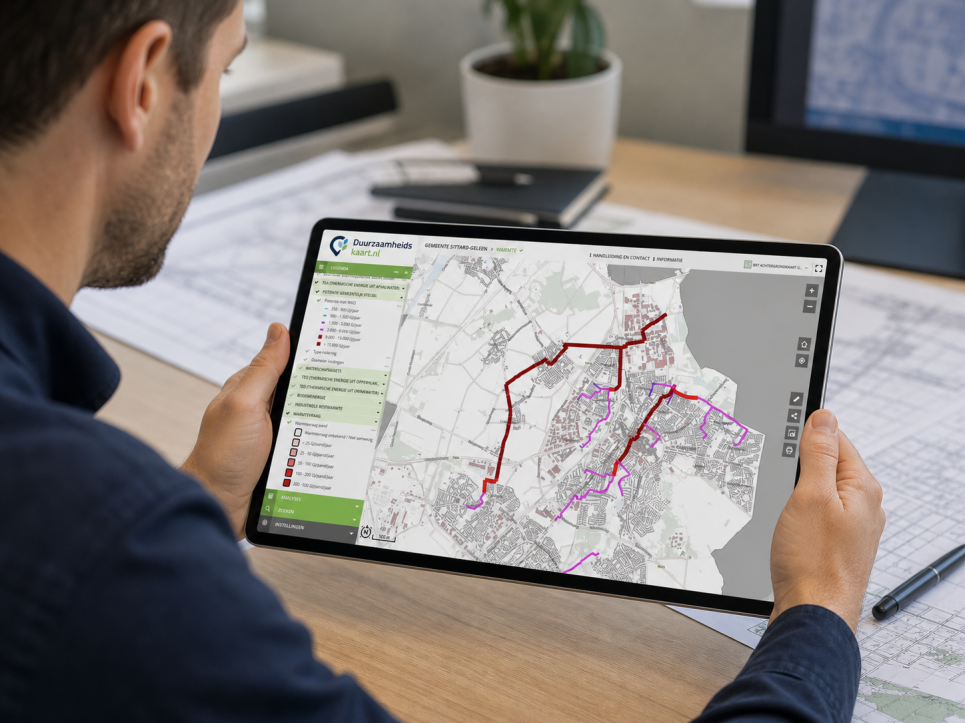
By linking emissions and material data to locations, organizations can make CO₂ impact geographically visible, compare scenarios, identify optimization opportunities and create stronger substantiation for reporting and decision-making. Instead of disconnected spreadsheets, a visual and analytical framework emerges that provides clearer context behind sustainability data.

🖼️
Image not available
This image could not be loaded

Spatial intelligence helps organizations move from estimation to substantiation

As sustainability requirements become stricter, organizations need insight that is not only measurable, but also explainable and defensible towards clients, regulators and stakeholders. This is especially important for contractors, infrastructure projects and executing parties where sustainability increasingly influences tenders, procurement processes and project accountability.

Duurzaamheidskaart helps organizations make emissions, material usage and sustainability impact geographically visible through spatial analyses, dashboards and location-based reporting. By connecting material data, emission factors and project locations, organizations gain clearer insight into where sustainability impact occurs and how decisions influence outcomes.

This helps organizations move beyond assumptions and fragmented reporting towards stronger transparency, better decision-making and more defensible sustainability insight.

👉 Discover how Duurzaamheidskaart supports spatial CO₂ analyses and reporting.

View All PostsGet a Demo

Related Posts

You might also like

GIS platforms in the Netherlands: what is the difference and where does GeoApps fit?

GIS platforms in the Netherlands: what is the difference and where does GeoApps fit?

A GIS platform is more than a map viewer. It supports organisation-wide spatial analysis, data-driven decision-making and communication using GIS and geospatial data.

January 14, 2026Read more
From Rigid to Smart GIS: Why More Organizations Are Switching to QGIS + GeoApps

From Rigid to Smart GIS: Why More Organizations Are Switching to QGIS + GeoApps

Many GIS environments are still stuck in old structures. High license costs, slow updates, and limited collaboration slow down innovation. Discover how organizations are moving to an open, flexible, and future-ready WebGIS with QGIS + GeoApps.

October 17, 2025Read more
How to Create Clarity in a Region Full of Sustainable Initiatives

How to Create Clarity in a Region Full of Sustainable Initiatives

Municipalities and regions are dealing with countless sustainability initiatives. GeoApps helps bring data together and make it transparent so that policies and collaboration are better supported.

September 30, 2025Read more
How Online Maps Help Ecological Consultancy Flourish

How Online Maps Help Ecological Consultancy Flourish

Digital maps make ecological consultancy work more efficient and transparent. Discover how GeoApps supports organizations in nature research, public participation, and policy development.

September 30, 2025Read more
MapTalk, the ideal participatory tool to involve citizens in spatial projects

MapTalk, the ideal participatory tool to involve citizens in spatial projects

MapTalk makes citizen participation simple and effective. From home or at community events, residents can share feedback that helps shape better spatial projects and smarter decisions.

September 30, 2025Read more
ESG Mapping for Municipalities: One Map That Connects Environment, Social and Governance

ESG Mapping for Municipalities: One Map That Connects Environment, Social and Governance

Municipalities increasingly face the challenge of bringing together climate data, social priorities and governance indicators. GeoApps and Duurzaamheidskaart now offer a single integrated ESG dashboard that gives policymakers real-time insight into energy, quality of life and implementation capacity. The result is a complete picture that supports transparent decision-making and accelerates sustainable goals.

September 30, 2025Read more

Ready to Get Started?

Join thousands of users who are already using GeoApps to transform their spatial data workflows.

Get a Demo
GeoApps Viewer
Gasfabriek project
MapGear team office
Last Updated: June 18, 2026