
RES Regions and Regional Energy Strategies: Working Together on the Transition
Discover how RES regions use Duurzaamheidskaart to support regional energy strategies, shared monitoring, and data-driven collaboration.
From Ambition to Execution
Regional Energy Strategies bring municipalities, provinces, water authorities, grid operators, and energy companies together to shape the energy transition. The Netherlands is divided into 30 RES regions, each with its own goals for renewable electricity and sustainable heat.
Because so many parties are involved, reliable shared data becomes essential. Collaboration requires up-to-date information, progress monitoring, and transparent reporting so every partner works from the same foundation.
Key questions include:
Are all parties working with the same current data?
How far are we in reaching RES targets?
Which projects are contributing to the energy transition?
How do we report progress to national government, decision-makers, and residents?
A central information environment helps answer these questions faster and more clearly.
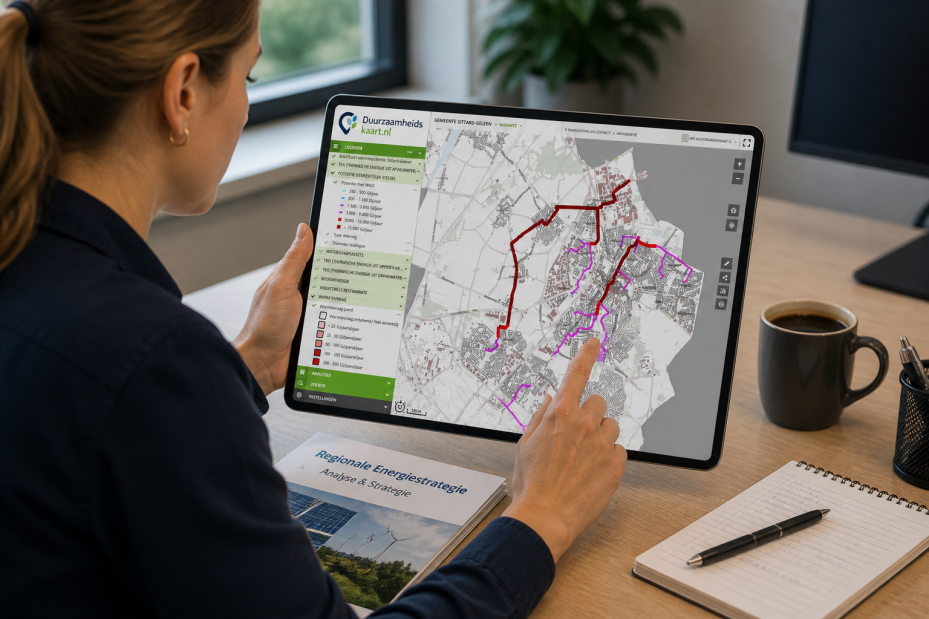
One Platform for Shared Insights
Duurzaamheidskaart supports RES regions by bringing information together in one accessible environment.
The platform helps partners gain insight into:
Solar and heat transition
Installed solar panel capacity per area
Potential for new solar projects
Available heat sources and heat demand
Progress compared to regional goals
Monitoring and reporting
Current data available centrally
Maps and dashboards for decision-making
Reports for accountability and monitoring
Comparisons between municipalities and areas
Regional collaboration
Transparent information for all partners
Shared analyses and scenarios
Evidence for RES agreements
Monitoring of regional progress
This creates a shared view of opportunities, bottlenecks, and results within the energy transition.
From RES 1.0 to RES 2.0
Now that the first RES goals have been established, the focus is shifting toward implementation, monitoring, and adjustment toward RES 2.0. Reliable data about completed and planned projects is becoming increasingly important.
A practical example is the RES region Holland Rijnland, where municipalities such as Rijswijk use Duurzaamheidskaart to monitor solar energy projects and the heat transition. With one shared data source, involved parties can collaborate more easily and gain better insight into regional progress.
By making information available at map, municipal, and regional level, Duurzaamheidskaart supports policymakers and project teams in:
Tracking completed projects
Analyzing regional developments
Supporting policy decisions
Monitoring progress toward RES 2.0
This makes the energy transition easier to understand, manage, and communicate.
👉 Discover how Duurzaamheidskaart supports RES regions with regional energy strategy and progress monitoring.
Ready to get started?
Discover how Duurzaamheidskaart can support your organization.