What is ESG mapping, and what is ESG-Maps?
ESG mapping puts environmental, social and governance data on a map. ESG-Maps is MapGear’s platform that makes that spatial insight usable for policy, monitoring and reporting.
What is ESG mapping?
ESG mapping is the practice of connecting environmental, social and governance (ESG) information to location. Instead of keeping indicators in separate spreadsheets, reports or dashboards, you place them on a map so you can see where they occur, how they overlap and which areas need attention first.
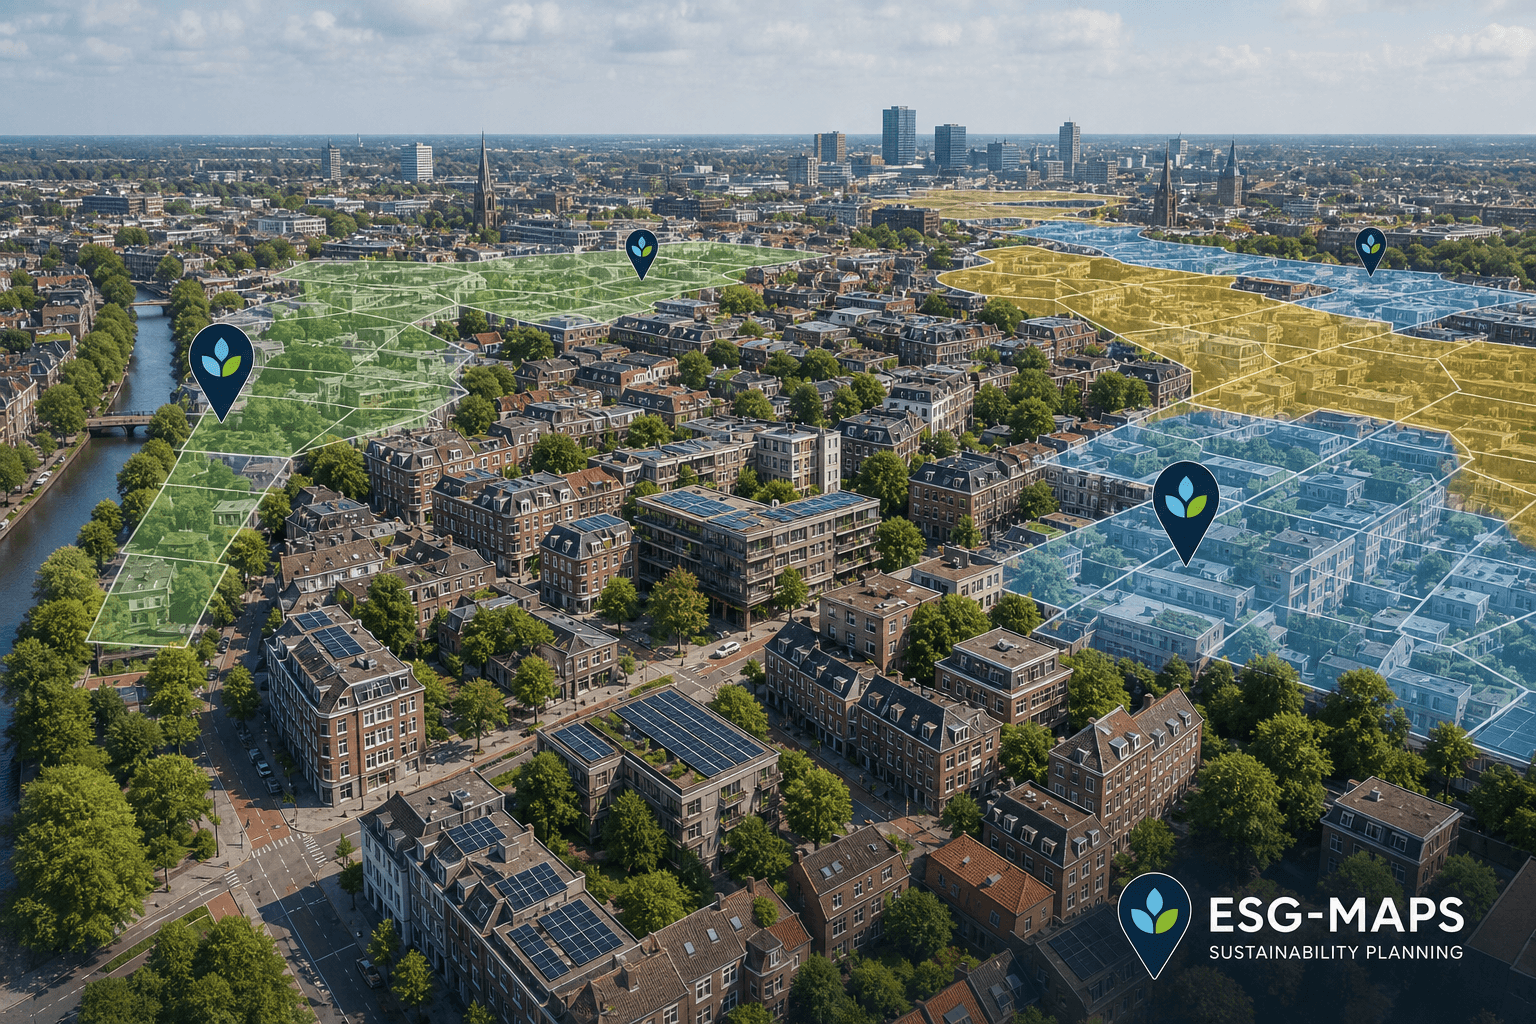
The idea is simple: sustainability is not the same everywhere. Heat stress, solar potential, energy labels, green space, flood risk and social vulnerability all vary from street to street. ESG mapping makes those differences visible, so organisations can compare neighbourhoods, buildings and project areas on a consistent geographic basis.
In practice, an ESG map can combine themes such as energy use, building performance, renewable energy potential, heat stress, water risk, tree cover, access to public green space, social infrastructure and the status of local projects. The result is not a single score, but a spatial overview that helps teams explain why one area is a priority and another is not.
What do the E, S and G mean on a map?
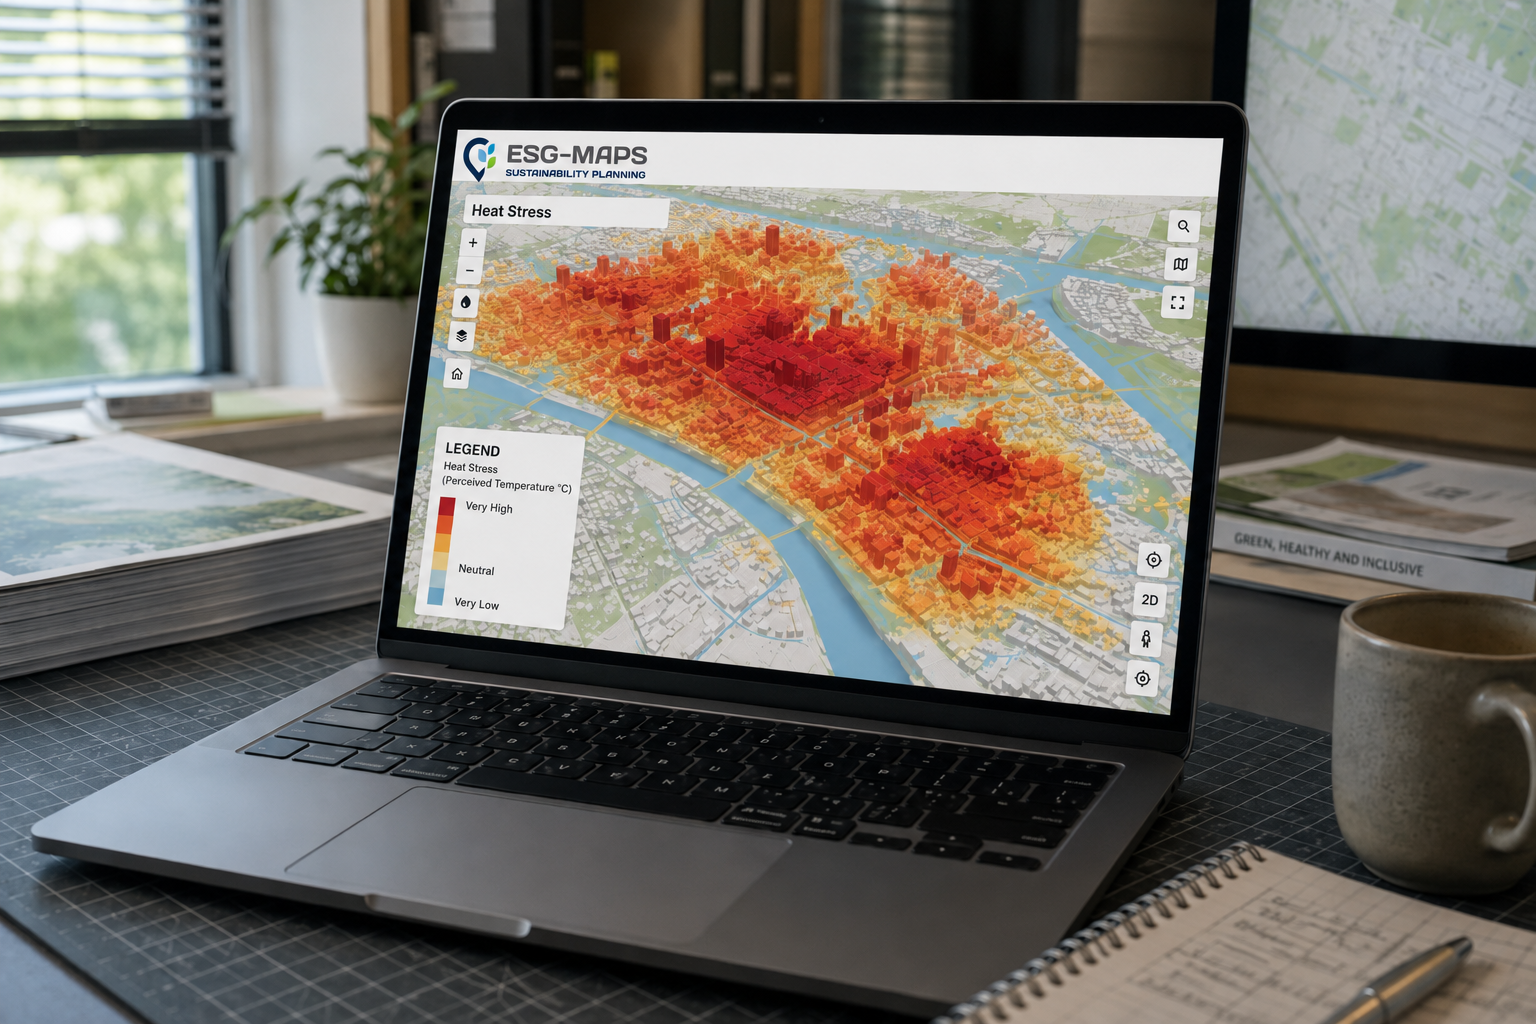
Environmental data shows how places perform on energy, climate, nature and environmental quality. Typical layers include solar potential, heat, drought, flooding, green roofs, asbestos roofs and canopy cover.
Social data adds context about people and liveability: who lives where, how easy it is to reach green space or amenities, and whether environmental burdens or benefits are spread evenly across an area.
Governance data makes policy and delivery visible. Projects, measures, responsibilities and targets can be linked to locations so teams can see what is already underway, where implementation is lagging and how progress relates to stated goals.
ESG mapping is useful because these three perspectives rarely sit in one system. When they do, organisations can see, for example, where high heat exposure coincides with little shade, or where older housing stock overlaps with energy-poverty risk and planned insulation programmes.
What is ESG Maps?
ESG Maps is MapGear’s sustainability data platform. It turns ESG mapping into a working environment: interactive maps, analysis tools and reports that municipalities, provinces, housing associations, water authorities and consultants can use together.
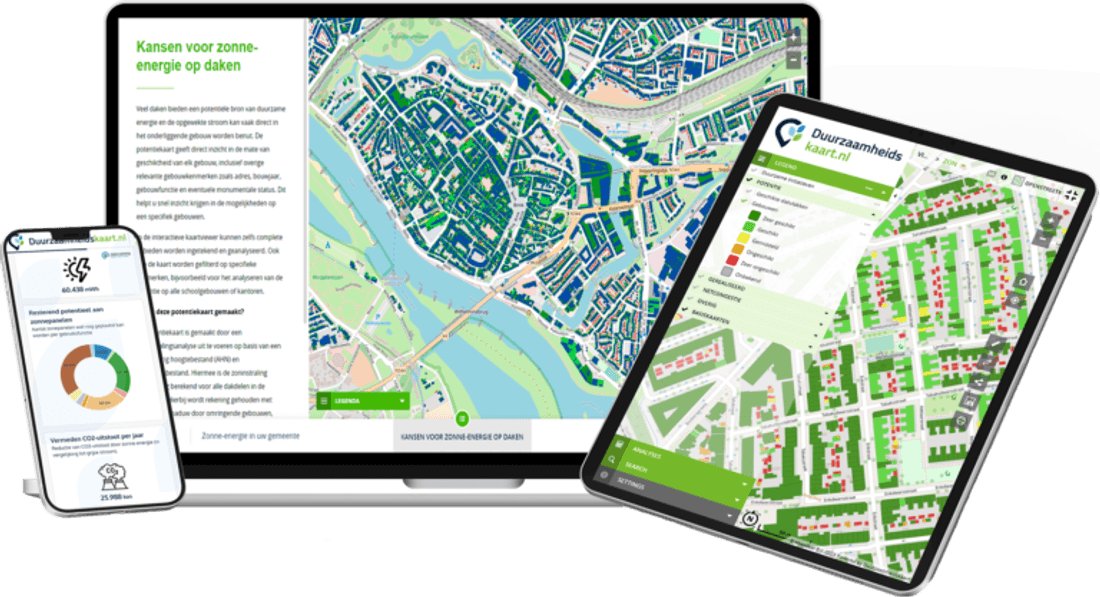
Where ESG mapping is the method, ESG Maps is the product that puts that method into practice. The platform brings current sustainability data together in one place, with products for themes such as solar energy, heat, climate adaptation, urban heat, green insight, green roofs, asbestos roofs, species management and home insulation.
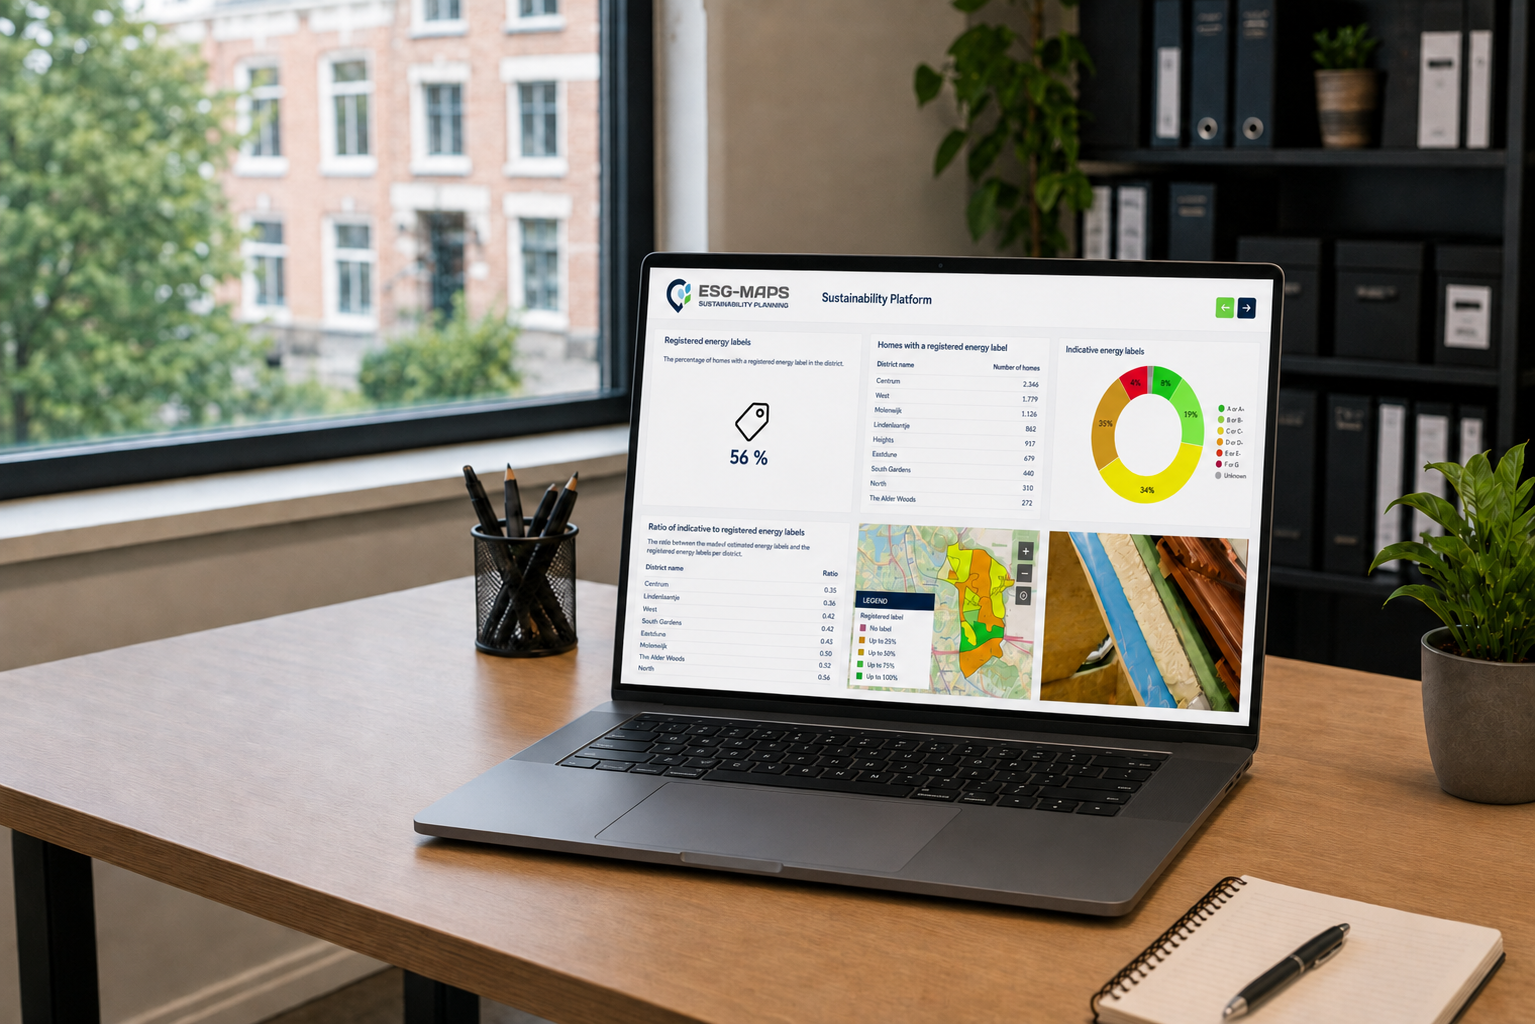
ESG Maps is built for organisations that need insight they can share. Maps can be used for analysis, monitoring and reporting. The same environment can support internal policy work and communication with residents, partners or council members. Because the data is location-based, teams can zoom from a municipality-wide overview to a neighbourhood, a roof or a project area.
How ESG mapping and ESG Maps fit together
ESG mapping answers the question: where do environmental, social and governance issues meet? ESG Maps is the platform that keeps that picture up to date and usable. It is designed so you do not have to rebuild a GIS project every time a new aerial photo, energy dataset or climate layer becomes available.
That distinction matters when organisations start with ESG reporting. A report can list indicators. A map can show where those indicators concentrate, which measures are already in place and where a single intervention could serve several goals at once. ESG Maps is how MapGear delivers that spatial working method as a service, with annual data updates and tools for analysis and monitoring.
Who uses it?
Typical users are municipalities and provinces that need a shared picture of energy, climate and liveability; housing associations that plan insulation, solar and asbestos programmes; water authorities and environmental agencies that work across municipal borders; and consultancies that advise on spatial sustainability.
If you are new to the topic, start with the definitions above. For a deeper look at how spatial ESG insight supports day-to-day decisions, see our later article on how ESG mapping turns sustainability data into spatial insight.
Want to see ESG Maps in your area?
Schedule a demo and we will show how ESG mapping works in practice on the ESG Maps platform.