Nature restoration becomes measurable: what municipalities should prepare now
The European Nature Restoration Regulation makes reliable monitoring of urban green increasingly important. Discover what this means for municipalities and how spatial data helps demonstrate green development.
Nature Restoration Is Becoming a Measurable Urban Challenge
The European Nature Restoration Regulation is making nature restoration more concrete and measurable across the EU. While the formal obligations sit with Member States, implementation will increasingly affect municipalities because urban green space, spatial development, biodiversity and long-term monitoring come together at local level.
The timing makes this especially relevant. All EU Member States must submit a draft national restoration plan to the European Commission by 1 September 2026. These plans will set out how countries intend to meet the regulation’s restoration targets, including measures for urban ecosystems.
For municipalities, this creates a practical question: do we know enough about how much urban green we have, where it is located and how it is changing over time?
From Green Ambitions to Measurable Progress
Cities and municipalities across Europe have been investing in urban greening, climate adaptation, biodiversity and healthier living environments for years. However, progress is often monitored through individual projects, tree inventories, policy indicators or occasional studies. This can make it difficult to compare developments consistently across neighbourhoods and over longer periods.
The Nature Restoration Regulation increases the importance of a reliable spatial baseline. By 31 December 2030, Member States must ensure that there is no net loss in the total national area of urban green space and urban tree canopy cover within designated urban ecosystem areas, compared with 2024. From 2031, Member States must achieve an increasing trend in urban green space, while tree canopy cover must increase within each urban ecosystem area until satisfactory levels are reached. These developments are measured every six years.
This does not mean that every municipality receives an identical individual EU target. However, local spatial data becomes increasingly important because national monitoring ultimately depends on reliable information about what is actually changing within cities and urban areas.
A Baseline Is Only the Beginning
To demonstrate change, organisations first need a reliable reference point. How much urban green and tree canopy cover existed in 2024? How was it distributed across neighbourhoods, and where has green space increased or disappeared since then?
The same indicators then need to be monitored consistently over time. Only by comparing measurement periods can municipalities see whether urban green is actually increasing or whether gains in one location are being offset by losses elsewhere.
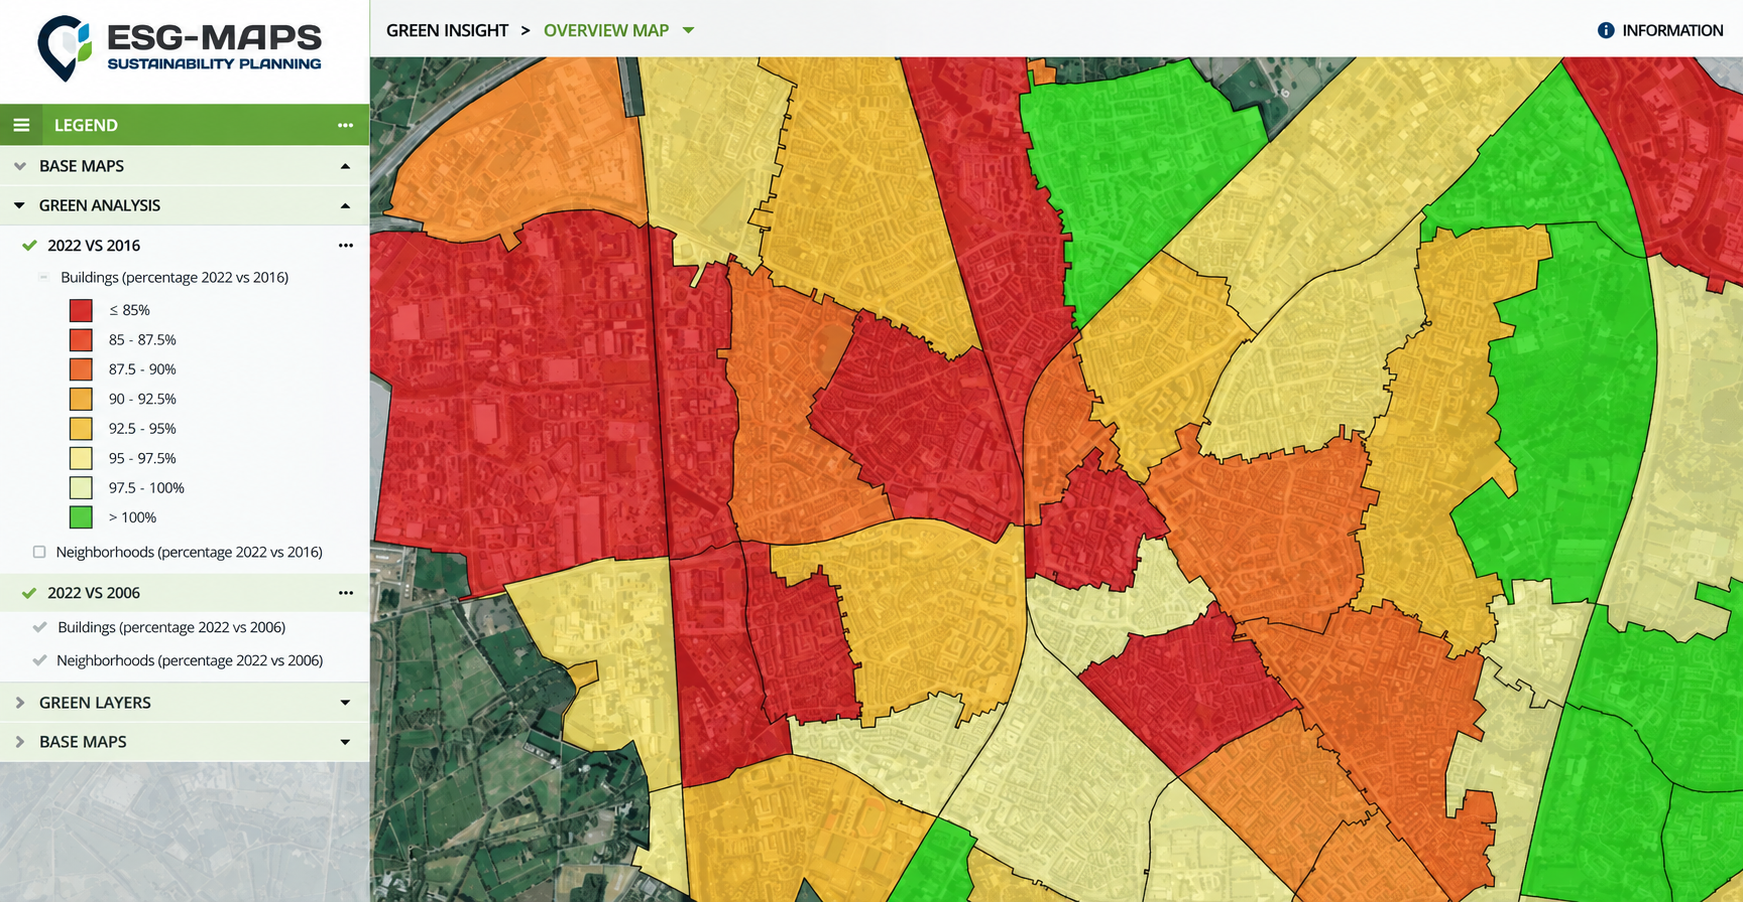
Relevant indicators can include:
total urban green space
urban tree canopy cover
number and location of trees
changes in canopy and vegetation between measurement periods
distribution of green across neighbourhoods
relationships between green space, heat, hard surfaces and buildings
areas where green space is disappearing or being added
Specialised spatial data can support this process. Aerial imagery, satellite data and elevation models can be used to detect trees and tree crowns and to analyse how they change over time. Tree counts alone do not tell the whole story. Canopy area and canopy volume can provide additional context because a mature tree can have a very different spatial and ecological value from a newly planted one.
Not Only How Much Green, but Where
A city-wide percentage only tells part of the story. Two municipalities can have similar overall levels of urban green while the distribution between neighbourhoods is completely different.
One neighbourhood may have extensive tree canopy cover, while another has little shade or limited access to green space. When green data is combined with information about heat stress, hard surfaces, population density and planned developments, municipalities can identify where greening may deliver the greatest additional value.
That is why spatial monitoring matters. The goal is not only to demonstrate that an indicator has changed, but to understand where that change is taking place and how it relates to spatial and policy decisions.
The same information can therefore support several policy areas at once, including climate adaptation, biodiversity, urban development and liveability.
Hengelo Shows How Data-Driven Green Monitoring Works
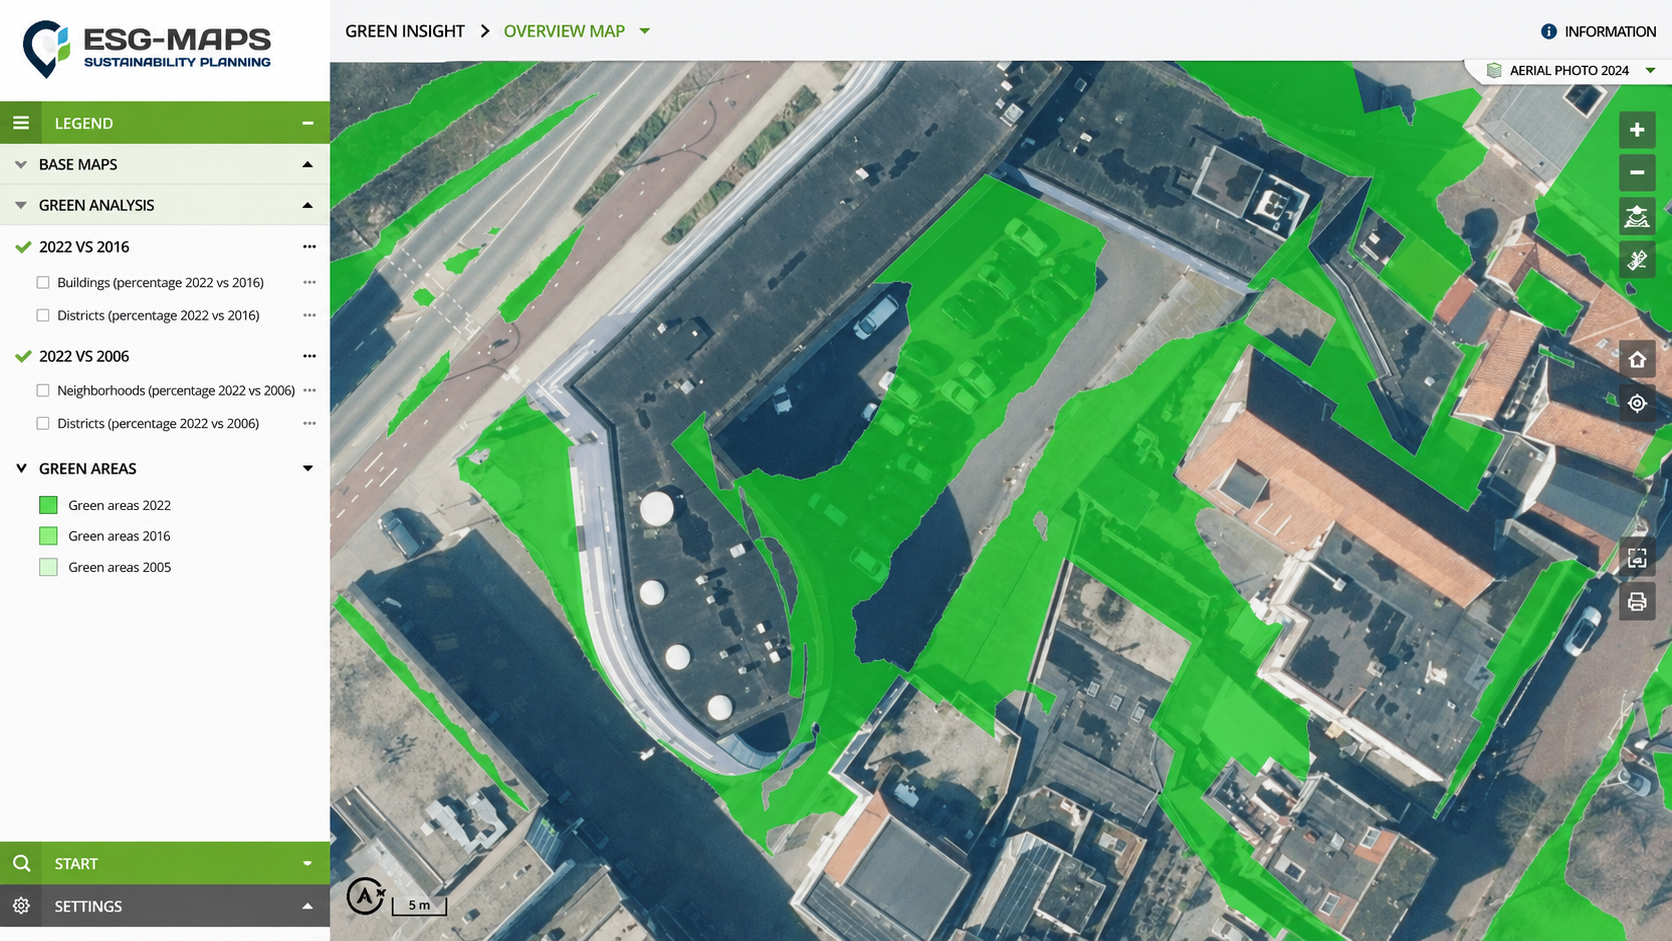
This way of working did not start with the Nature Restoration Regulation. In the Dutch municipality of Hengelo, spatial data analysis has already been used to make urban green trends visible and give the municipality more insight into developments, liveability and policy choices. The approach is presented as a Hengelo urban green case study
The principle behind it maps directly onto the challenge that is now becoming more important across Europe: not only knowing how much green is present, but being able to follow change systematically and connect it to specific locations.
By comparing historical and current green data, municipalities can identify where tree canopy is disappearing, where urban green is increasing and which neighbourhoods are falling behind. This provides a stronger basis for prioritisation than assessing green policy only through individual projects or the number of trees planted.
The experience in Hengelo shows that this data-driven approach was already practically applicable before the current regulation increased the need for structured monitoring. Today, the same type of spatial insight is becoming increasingly relevant for cities that need to understand and demonstrate long-term changes in their urban environment.
Monitoring Becomes Part of the Policy Process
The biggest change is unlikely to be one new map or dataset. Instead, it is the shift from occasional analysis towards structural monitoring.
When municipalities measure the same indicators repeatedly, they create a timeline of development. This makes it possible not only to see how urban green is changing, but also to assess whether interventions are producing the intended results.
This can help answer questions such as:
Which neighbourhoods are losing tree canopy?
Where can greening deliver the greatest climate adaptation benefits?
Which developments could contribute to the loss of urban green?
Where are the effects of municipal measures visible in the data?
How is the balance between vegetation, buildings and hard surfaces changing?
Which areas should receive additional attention in the coming years?
Monitoring therefore becomes more than a reporting exercise. The same evidence can support policy development, investment decisions and spatial planning.
One Spatial Overview for Multiple Policy Goals
Data-driven green monitoring becomes more valuable when information is not isolated within a single nature or green-space dataset. Urban green connects directly with several municipal policy areas.
Tree canopy can provide shade during periods of extreme heat. Green space can contribute to water retention, biodiversity, health and quality of life. At the same time, housing, transport infrastructure and other urban developments can place pressure on the same limited space.
Bringing these datasets together in one spatial environment makes it easier to identify where objectives reinforce one another and where potential conflicts emerge. In this way, urban-green monitoring can become a shared evidence base for broader spatial decisions rather than a separate environmental exercise.
From Nature Restoration Regulation to Better Evidence-Based Green Policy
The Nature Restoration Regulation makes clear that nature restoration is not only an ambition. Progress also needs to be measurable. For EU Member States, reliable reference data, monitoring and spatial evidence will therefore become increasingly important as national restoration plans are implemented and the 2030 targets approach.
For municipalities, this also creates an opportunity. The data used to understand changes in urban green can simultaneously help target policies, prioritise investments and support better-informed decisions around climate adaptation, biodiversity and urban development.
The experience in Hengelo demonstrates that this type of data-driven approach can already be applied in practice. The Nature Restoration Regulation now makes the value of consistent, long-term monitoring even clearer.
Do You Know How Urban Green Is Changing Across Your Municipality?
Discover how Urban Green helps organisations visualise spatial green data, compare changes over time and build a stronger evidence base for urban-green policy.
Get in touch to discuss how spatial green monitoring can support your municipality or region.