Mapping Heat Stress: Smarter Decisions for a Cooler Living Environment
Heat does not affect every neighbourhood equally. Discover how municipalities can combine heat, green space, shade and vulnerability data to identify where cooling measures are needed most and make climate adaptation more targeted.
Heat stress is not distributed evenly across a municipality. One street can remain shaded and comfortable while another nearby stays hot well into the evening. Paving, building density, green space, shade and water all influence how heat is experienced locally. For municipalities, knowing that temperatures are rising is only the starting point. The real challenge is identifying where heat becomes a problem, which neighbourhoods need attention first and where cooling measures can make the greatest difference.
The average temperature hides the neighbourhoods suffering most
A municipality-wide average can make the situation look manageable while individual neighbourhoods experience far more severe conditions. Dense areas with extensive paving and limited greenery often heat up faster and cool down more slowly than greener parts of the same city. When those differences are hidden inside one average figure, the streets that need attention most can easily disappear from view.
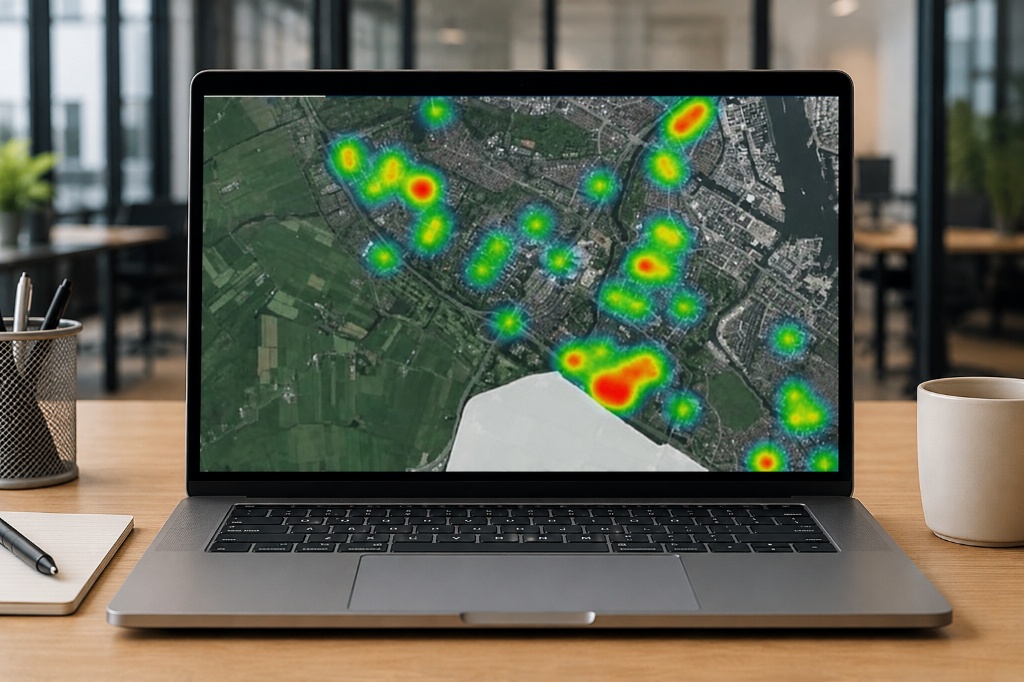
Spatial heat analysis changes that. By combining heat data with information on green space, shade, water and paved surfaces, municipalities can see where hotspots form and why certain neighbourhoods are more exposed than others. The question then shifts from “How warm is our municipality?” to “Where are residents feeling the heat most?”
Every cooling measure costs money. Put it where people need it most
Trees, shaded routes, green spaces and changes to paving all require budget, space and implementation capacity. That makes prioritisation essential. Applying the same solution everywhere may look fair on paper, but it does not reflect the reality of how heat affects different neighbourhoods.
One area may benefit most from additional tree cover, while another needs more shade around walking routes, schools or public spaces. Elsewhere, reducing paving or creating more accessible cool places may have a greater effect. Heat-stress maps help municipalities compare locations and target measures where they are most likely to improve daily life.
The goal is not simply to identify the hottest point on the map. It is to understand where an intervention can create the greatest benefit for the people who live, work and move through that neighbourhood.
Heat does not happen in isolation. Neither should your response
Urban heat is closely connected to other climate-adaptation challenges. More green space can provide cooling while also supporting biodiversity and water retention. Reducing paved surfaces can lower heat accumulation while improving rainwater infiltration. A neighbourhood facing heat stress may also be dealing with flooding, drought or limited access to green space.
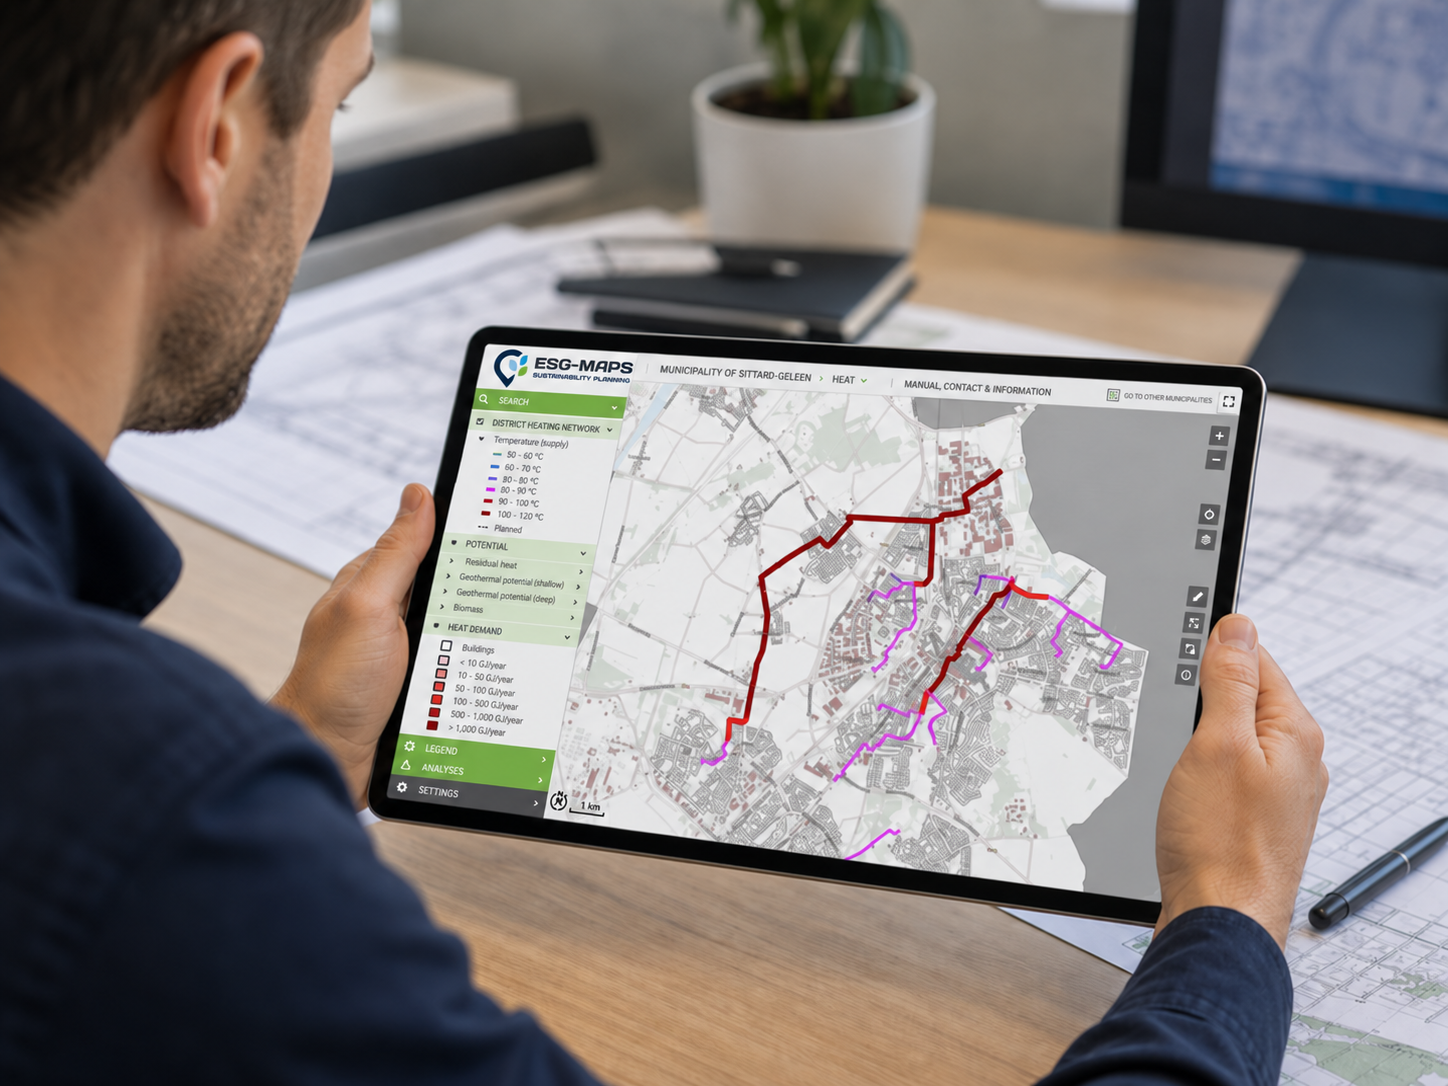
That is why heat policy becomes more useful when it is connected to broader climate information. ESG Maps allows municipalities to bring heat, green space and other sustainability data together in one spatial environment, making it easier to see where challenges overlap and where one measure could support several objectives at once.
Instead of treating heat as a separate problem, policy teams can work from a more complete picture of what each neighbourhood needs.
A completed measure means little if residents still feel the heat
Planting trees or creating a new green area is an important step, but completing a measure does not automatically mean the problem is solved. The real question is whether conditions actually improve afterwards. Are streets cooler? Is more shade available? Are the neighbourhoods with the greatest heat burden becoming more resilient?
This is where monitoring becomes just as important as implementation. ESG Maps helps municipalities compare neighbourhoods, follow developments and connect measures with changing conditions over time. That gives policy officers a clearer basis for understanding whether interventions are working and where additional action may still be needed.
Climate adaptation should not stop when a project is marked complete. What matters is whether residents experience a cooler, healthier and more liveable neighbourhood as a result.
From a general heat challenge to neighbourhood-level priorities. From completed measures to visible impact.
Where is heat stress hitting your municipality hardest?