Mapping Heat Stress: Smarter Decisions for a Cooler Living Environment
Discover how municipalities can combine heat, shade, green space and vulnerability data to identify priority areas and plan a cooler, healthier living environment.
See Where Heat Creates the Greatest Risk
Heat stress is becoming an increasingly important challenge in towns and cities. Buildings, roads and paved public spaces absorb and retain heat, while neighbourhoods with limited greenery or shade often provide fewer opportunities for residents to cool down.
For municipalities, the challenge is not only to understand that heat is increasing. They must also determine where the greatest risks occur, which residents are most exposed and where measures such as trees, shade, water or changes to public space can have the greatest effect.
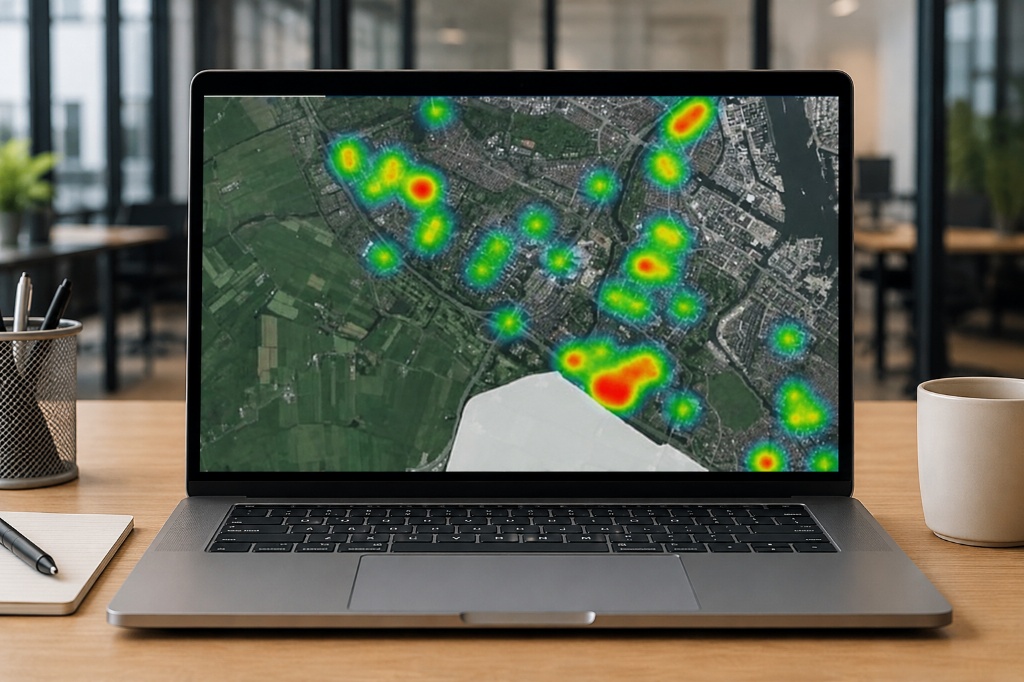
Heat maps bring these factors together spatially. By combining information about temperature, paving, green space, shade, cool places and vulnerable groups, municipalities gain a clearer foundation for prioritising climate-adaptation measures. ESG-Maps’ Heat Insight is designed to support this type of cooling planning and spatial analysis.
Identify Where Heat and Vulnerability Overlap
A warm neighbourhood does not automatically have the highest level of risk. The impact of heat also depends on who lives there, how easily people can reach a cooler place and whether shaded walking routes or green public spaces are available.
For this reason, a useful heat analysis should look beyond surface temperature alone. Municipalities can combine several types of information, including:
heat-sensitive streets and neighbourhoods;
paved surfaces and areas with limited vegetation;
existing trees, parks and water;
shaded and unshaded walking routes;
the distance to accessible cool places;
locations used by older people or other potentially vulnerable groups.
Bringing these layers together helps reveal where heat exposure and social vulnerability reinforce one another. This enables project teams to distinguish between areas that are simply warm and areas where heat may have a greater effect on health, accessibility and quality of life.
Prioritise Measures Where They Can Have the Greatest Effect
Municipalities rarely have the space or budget to implement every possible cooling measure at once. Spatial analysis therefore helps determine which interventions deserve priority.
One neighbourhood may benefit most from additional street trees and shaded walking routes. Another may require more accessible public green space, less paving or a cooler design for a square or school environment. In some locations, water or temporary shade structures may complement long-term greening.
Heat maps make it easier to compare areas and investigate the relationship between heat, green space, water, shade and the built environment. Heat Insight supports the analysis of heat islands, cool places, vulnerable groups and the possible effect of cooling measures within one map environment. The goal is not simply to select the warmest location. It is to identify where a realistic intervention can create the greatest improvement for the people who use the area.
Connect Heat Policy to Wider Climate-Adaptation Planning
Heat stress is closely connected to other spatial challenges. Additional greenery can contribute to cooling, biodiversity and water retention. Reducing paved surfaces may improve infiltration while lowering heat accumulation. Changes to walking routes and public spaces can also affect accessibility, mobility and the overall quality of the neighbourhood.
Consequently, heat policy should not be treated as a separate map or one-off analysis. It should form part of a wider climate-adaptation approach in which departments such as public health, urban planning, green-space management and infrastructure work from the same spatial picture.
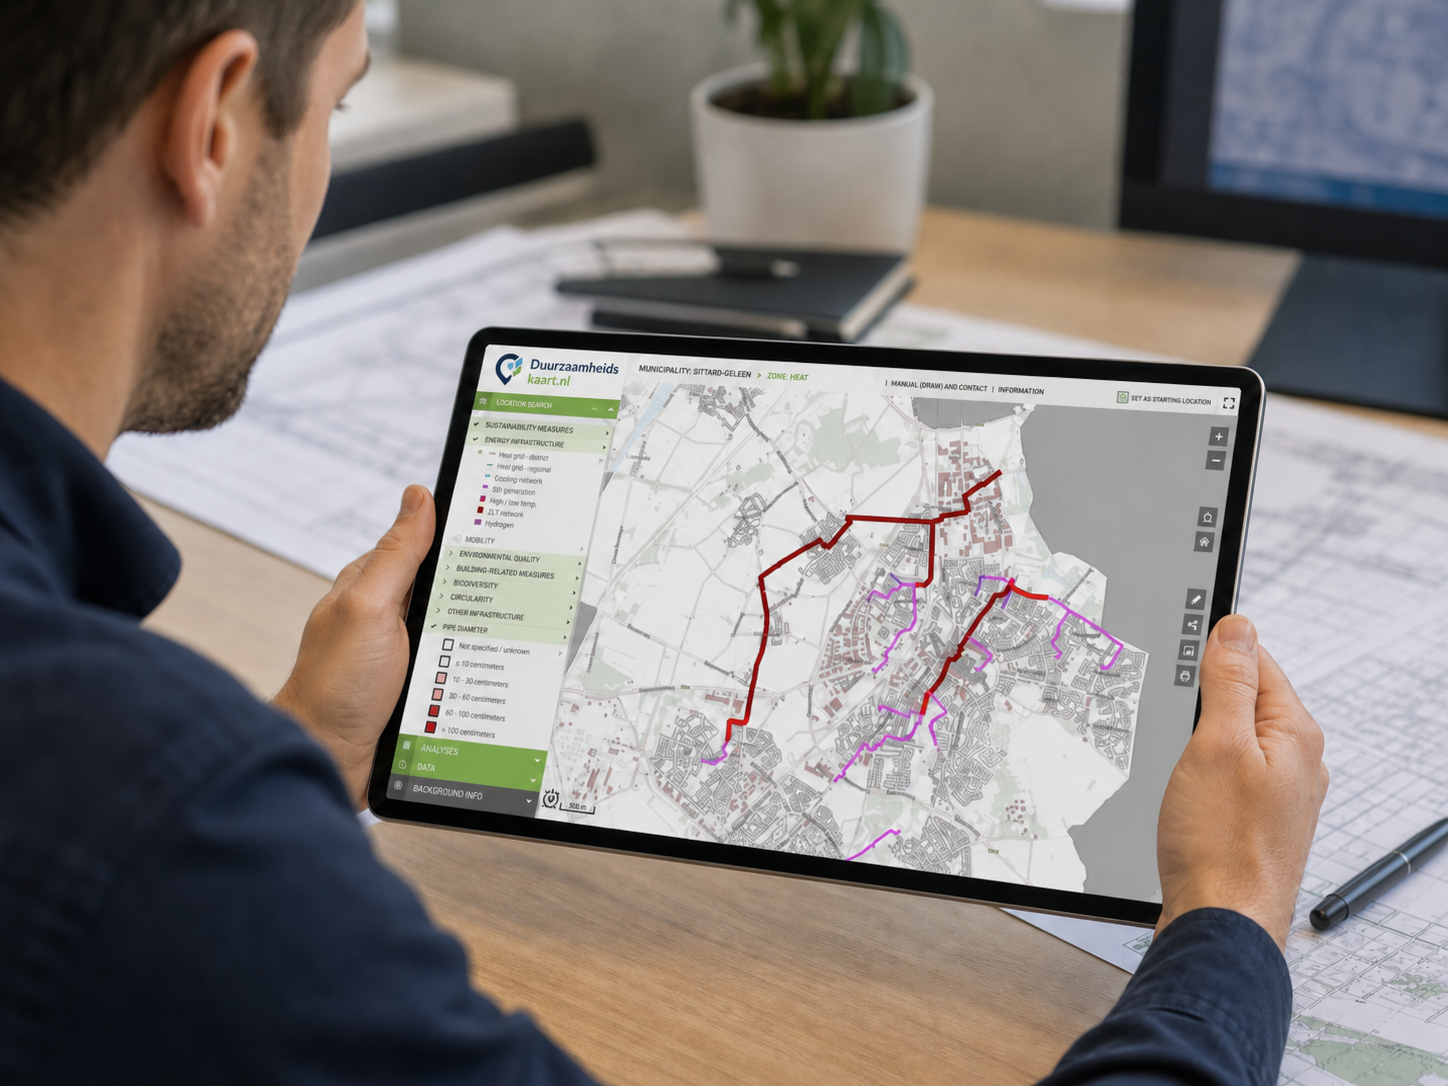
ESG Maps brings sustainability and climate-adaptation information together through interactive maps, dashboards and reporting tools. Its platform includes dedicated products for heat, green space and broader climate-adaptation monitoring, allowing organisations to analyse related themes within one environment.
This shared foundation makes it easier to coordinate measures, explain priorities and show how individual interventions contribute to wider policy objectives.
Monitor Progress and Explain Decisions Clearly
A heat map is most valuable when it supports an ongoing process rather than a single project moment. Municipalities need to understand the current situation, select measures and later assess whether conditions are changing.
Periodic updates and dashboards can help teams compare neighbourhoods, track trends and report progress to administrators, project partners and residents. Heat Insight uses periodically updated information, including satellite and weather data, to support stable maps and longer-term analysis rather than only acute heat alerts.
Clear visualisation also improves communication. A map can show why one neighbourhood receives priority, which factors influenced that decision and how planned measures relate to heat, shade, green space and vulnerable residents.
This transparency helps move the discussion beyond general ambitions. Instead of saying that a municipality wants to become cooler and more climate-resilient, teams can show where action is needed and how progress will be monitored.
Make Heat Stress Actionable
A cooler living environment begins with a clear understanding of where heat, limited cooling opportunities and vulnerability come together.
By combining heat data with information about shade, greenery, water, accessibility and residents, municipalities can prioritise measures more effectively and connect heat policy to wider climate-adaptation goals.
Would you like to identify heat-sensitive areas and determine where cooling measures can have the greatest impact?