Urban Heat Monitoring: From Heat Maps to Cooling Action
A heat map can show where temperatures are high. Urban heat monitoring goes further by helping municipalities track whether cooling, greening and shade measures are actually improving neighbourhood conditions over time.
A heat map can reveal where temperatures are highest, but for municipalities investing in trees, shade, green space and reduced paving, another question quickly becomes just as important: are those measures actually improving conditions? Heat stress varies from one neighbourhood to another because paving, building density, vegetation, shade and water all influence how heat is experienced locally.
Spatial analysis helps make those differences visible, but identifying the problem is only the beginning. Urban heat monitoring adds the next step by comparing neighbourhoods over time, following changing conditions and connecting cooling measures with the places where they were introduced.
A completed project does not automatically mean a cooler neighbourhood
Planting trees, adding shade or creating green space is an important milestone, but completing the intervention does not necessarily show whether the original heat problem has improved. Municipalities still need to know whether streets are becoming cooler, whether more shade is available along important walking routes and whether neighbourhoods with a high heat burden are becoming more resilient.
By keeping heat, green space, shade and other spatial indicators visible in one environment, municipalities can continue assessing an area after implementation instead of treating completion as the end of the process. This changes the focus from “Was the measure delivered?” to “Did conditions actually improve?”
Yesterday’s heat map should not become tomorrow’s assumption
Urban environments change continuously as new development, vegetation growth, changes in paving and other interventions affect how heat is experienced locally. Therefore, a heat analysis becomes more useful when it can be revisited rather than treated as a one-off snapshot.
ESG Maps Heat Insight supports longer-term spatial analysis with periodically updated information, including satellite and weather data. This allows policy teams to compare neighbourhoods and follow changes over time while keeping the geographic context of earlier decisions visible, rather than relying on an old heat map to explain today’s situation.
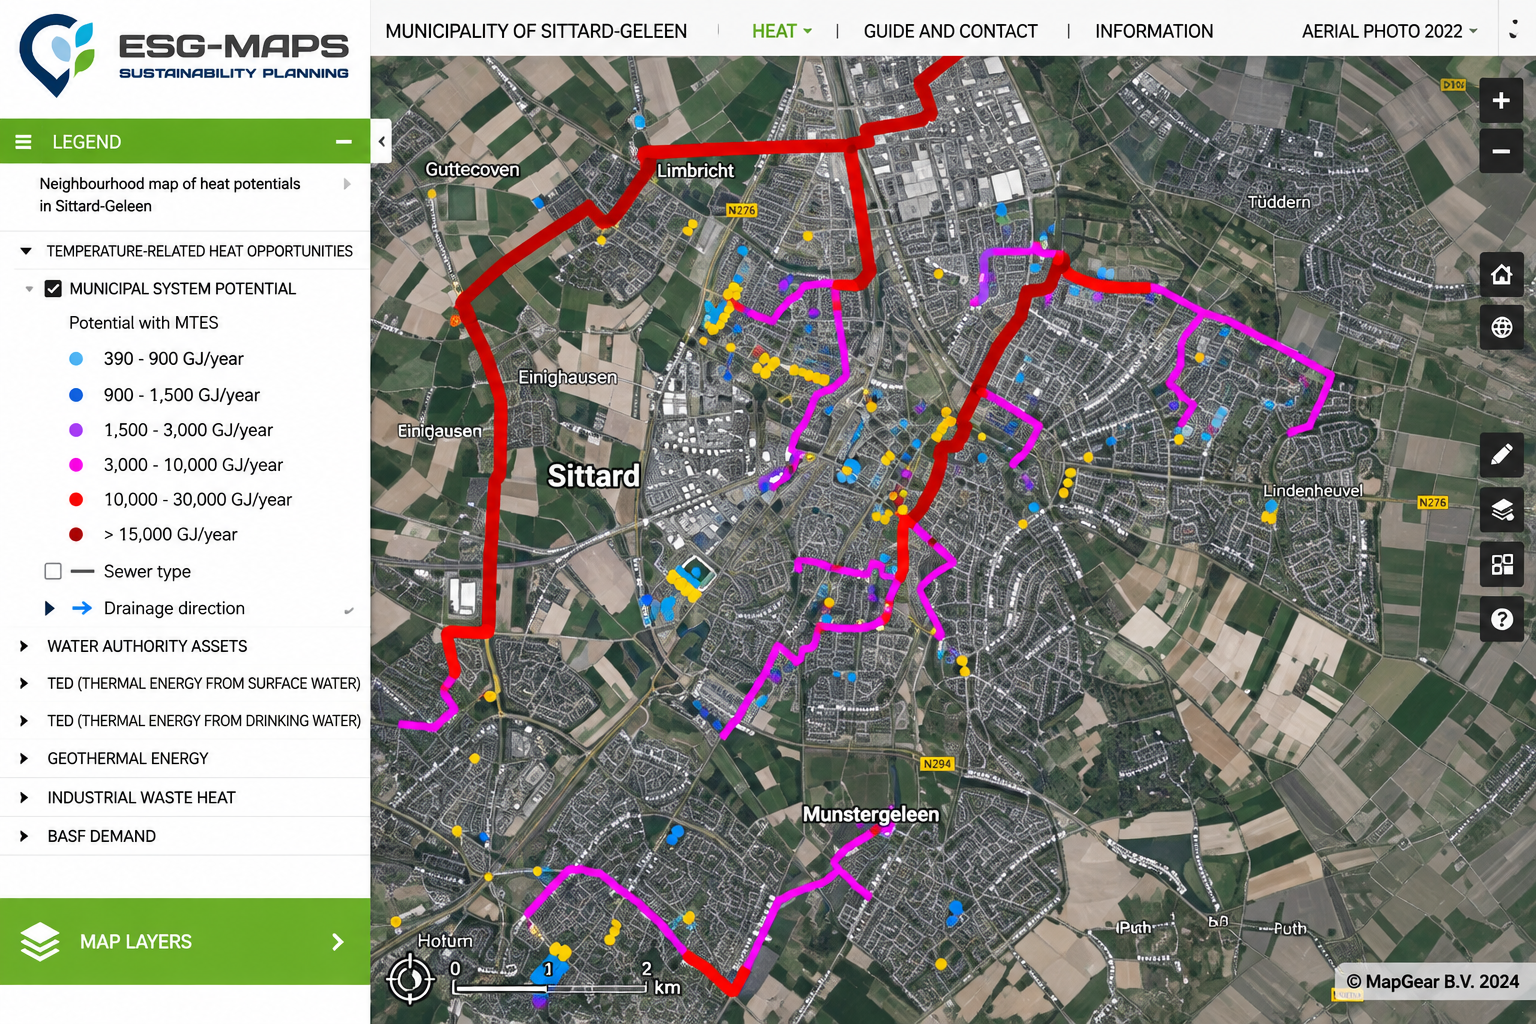
ESG Maps Heat Insight showing urban heat patterns and spatial monitoring data
Cooling one street can support more than one climate goal
Heat does not exist separately from other urban challenges. Additional vegetation can provide cooling while also supporting biodiversity and water retention, while reducing paved surfaces can limit heat accumulation and improve rainwater infiltration.
For that reason, monitoring heat becomes more useful when it is connected to wider climate-adaptation information. ESG Maps brings heat, green space and other sustainability data together within one spatial environment, helping policy teams see where challenges overlap and where one intervention may contribute to several objectives at once.
The real measure of cooling is what changes afterwards
A successful heat policy is not simply a collection of completed projects. Ultimately, it is about whether neighbourhoods become cooler, healthier and more liveable, and urban heat monitoring gives municipalities a way to keep that question visible after implementation.
By comparing areas, following changes and connecting measures with spatial conditions, teams gain a stronger basis for deciding whether an intervention is working and where further action may still be needed. This also makes progress easier to communicate because municipalities can show how neighbourhood conditions are developing over time, rather than reporting only that trees were planted or paving was removed.
Where are your cooling measures making a visible difference? ESG Maps Heat Insight helps municipalities compare heat-sensitive areas, green space, shade and cooling opportunities within one spatial environment.