From Data to Policy: Sustainability-as-a-Service for Municipalities
Municipalities are increasingly moving from one-off sustainability maps to continuously managed data environments. Discover how Sustainability-as-a-Service connects current data, spatial analysis and policy in one structured approach.
Municipalities work with an increasing amount of sustainability data. Energy consumption, solar panels, building insulation, sustainable heat, climate adaptation, green space and environmental risks all generate valuable information. The challenge is rarely a lack of data. The challenge is keeping that information connected, current and useful.
Datasets are often spread across different departments, dashboards, reports and individual projects. One team may work with energy data while another maintains climate information, and policy officers may rely on yet another set of maps or spreadsheets. The information exists, but the structure needed to use it consistently in policy, analysis and communication is often missing.
This is why more municipalities are moving beyond individual sustainability maps towards a continuous approach to managing sustainability information. That approach can be described as Sustainability-as-a-Service.
Sustainability data is growing, but the connections are missing
Many sustainability maps begin with a specific policy question. A municipality may want to understand rooftop solar potential, identify neighbourhoods with high heat stress or analyse opportunities for home insulation. A map built for one question can provide useful insight, but sustainability challenges do not stand still.
New datasets become available, policy priorities change and new measures are introduced. Different departments may also need the same information for different purposes. Without a clear structure for updating and managing those datasets, useful information gradually becomes fragmented across separate applications and projects.
For policymakers, this makes it increasingly difficult to maintain one reliable overview. A map therefore becomes much more valuable when the underlying information is continuously maintained and connected to the wider policy process.
From one-off maps to a continuous approach
The energy transition and climate adaptation require continuous insight. Municipalities need to monitor developments, compare areas, evaluate measures and support decisions with reliable information. Sustainability data therefore needs to be more than available. It also needs to remain current, consistent and accessible.
Sustainability-as-a-Service provides a different model. Instead of developing a map once and treating the project as complete, municipalities work with an environment in which datasets, maps and analyses can continue to evolve. This creates one foundation for policy, implementation and communication.
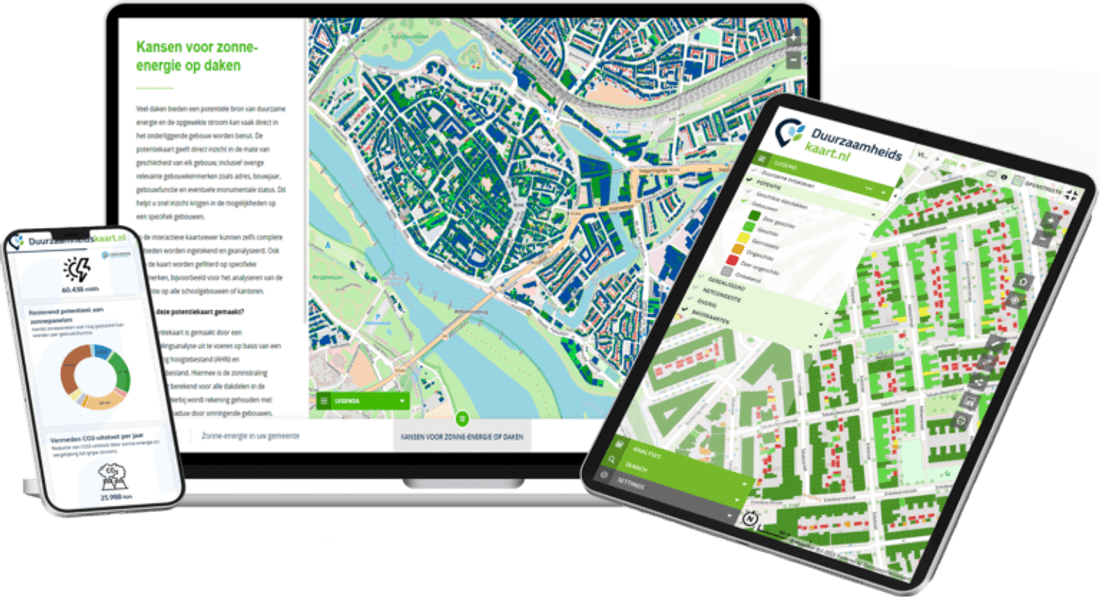
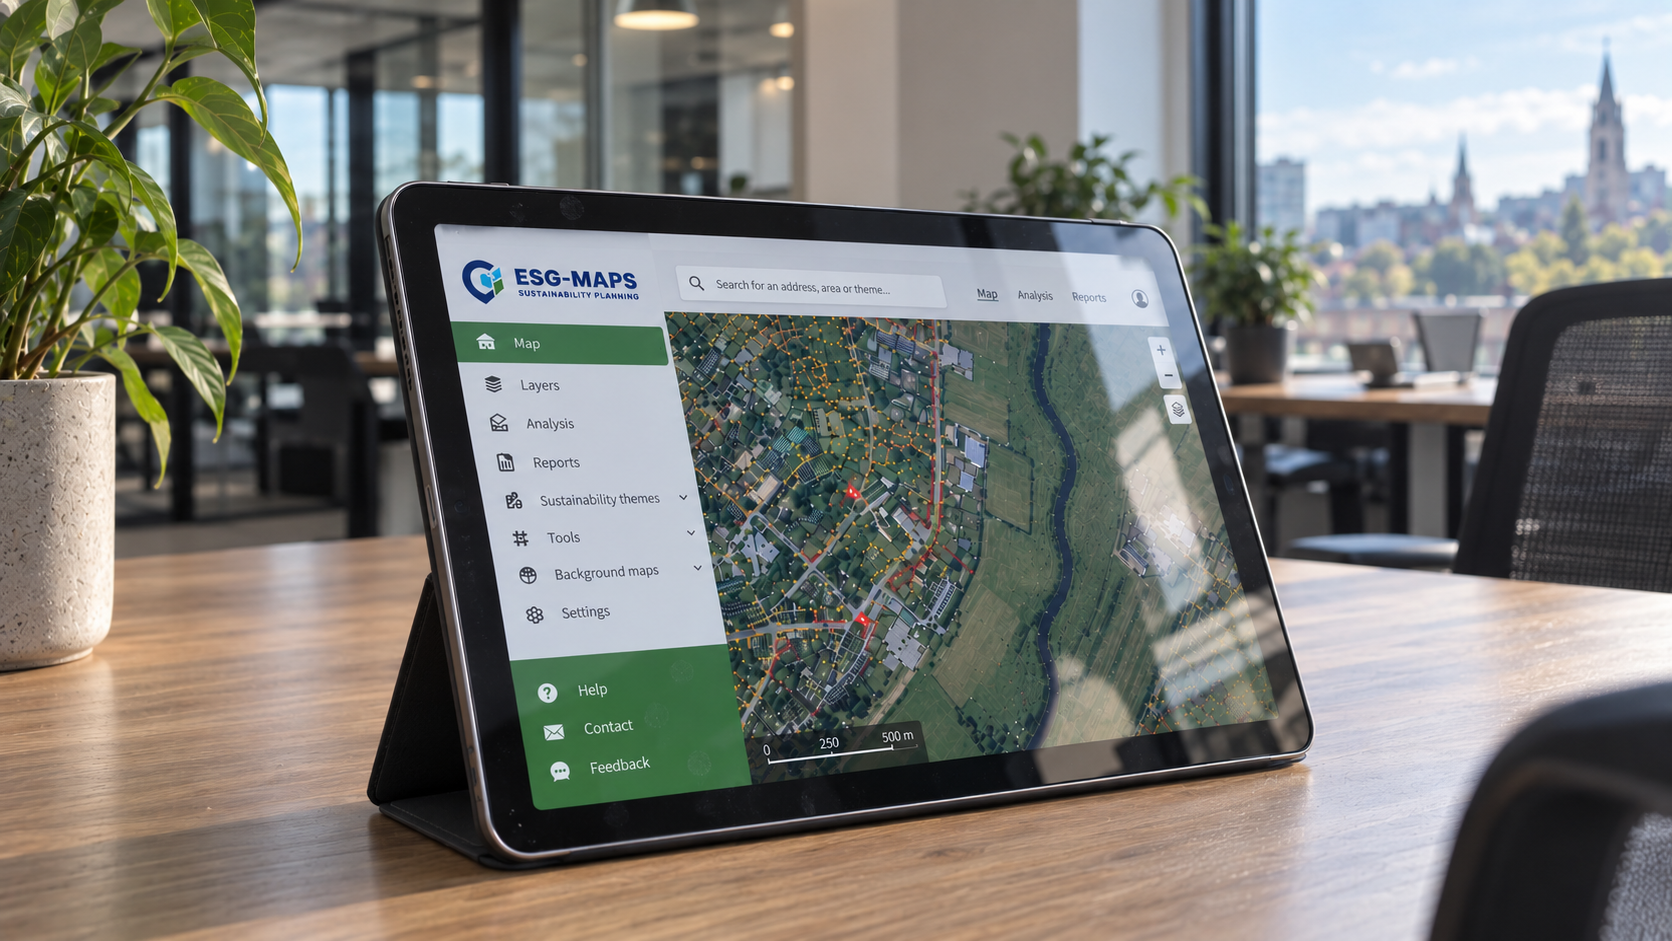
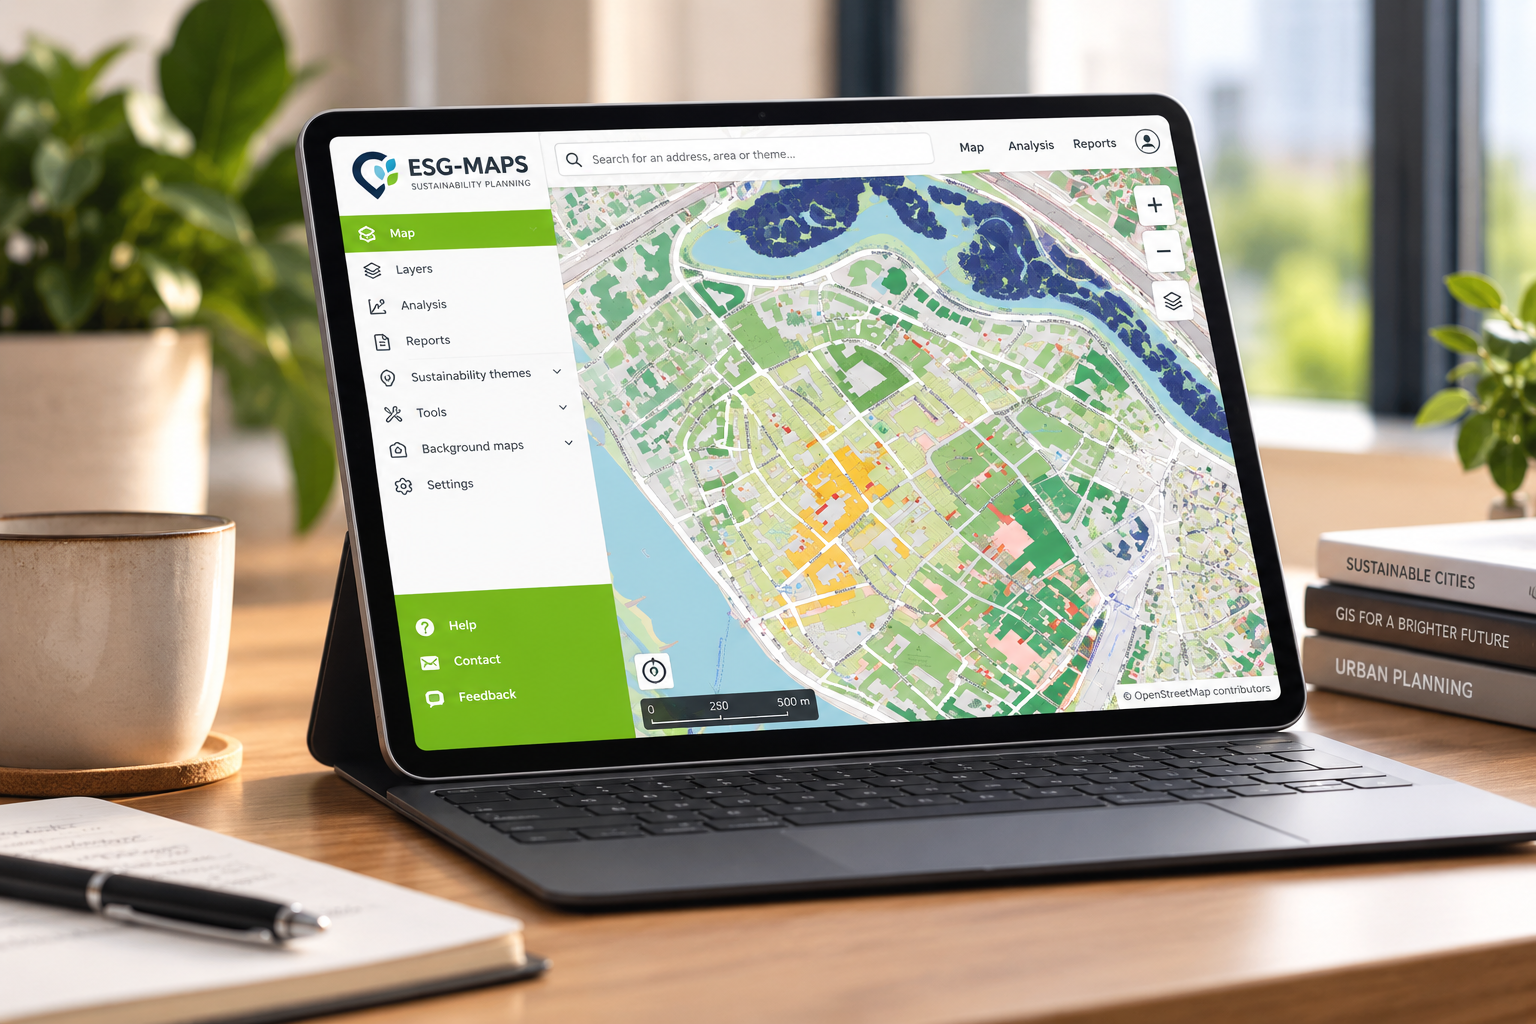
ESG Maps supports this approach by bringing sustainability information together in one environment where maps, analyses, dashboards and reporting can be combined.
One sustainability data platform for policy and analysis
When sustainability data is organised structurally, the role of the map changes. It is no longer simply a visualisation used to communicate information. It becomes a practical policy instrument that helps teams understand what is happening, where it is happening and where further action may be needed.
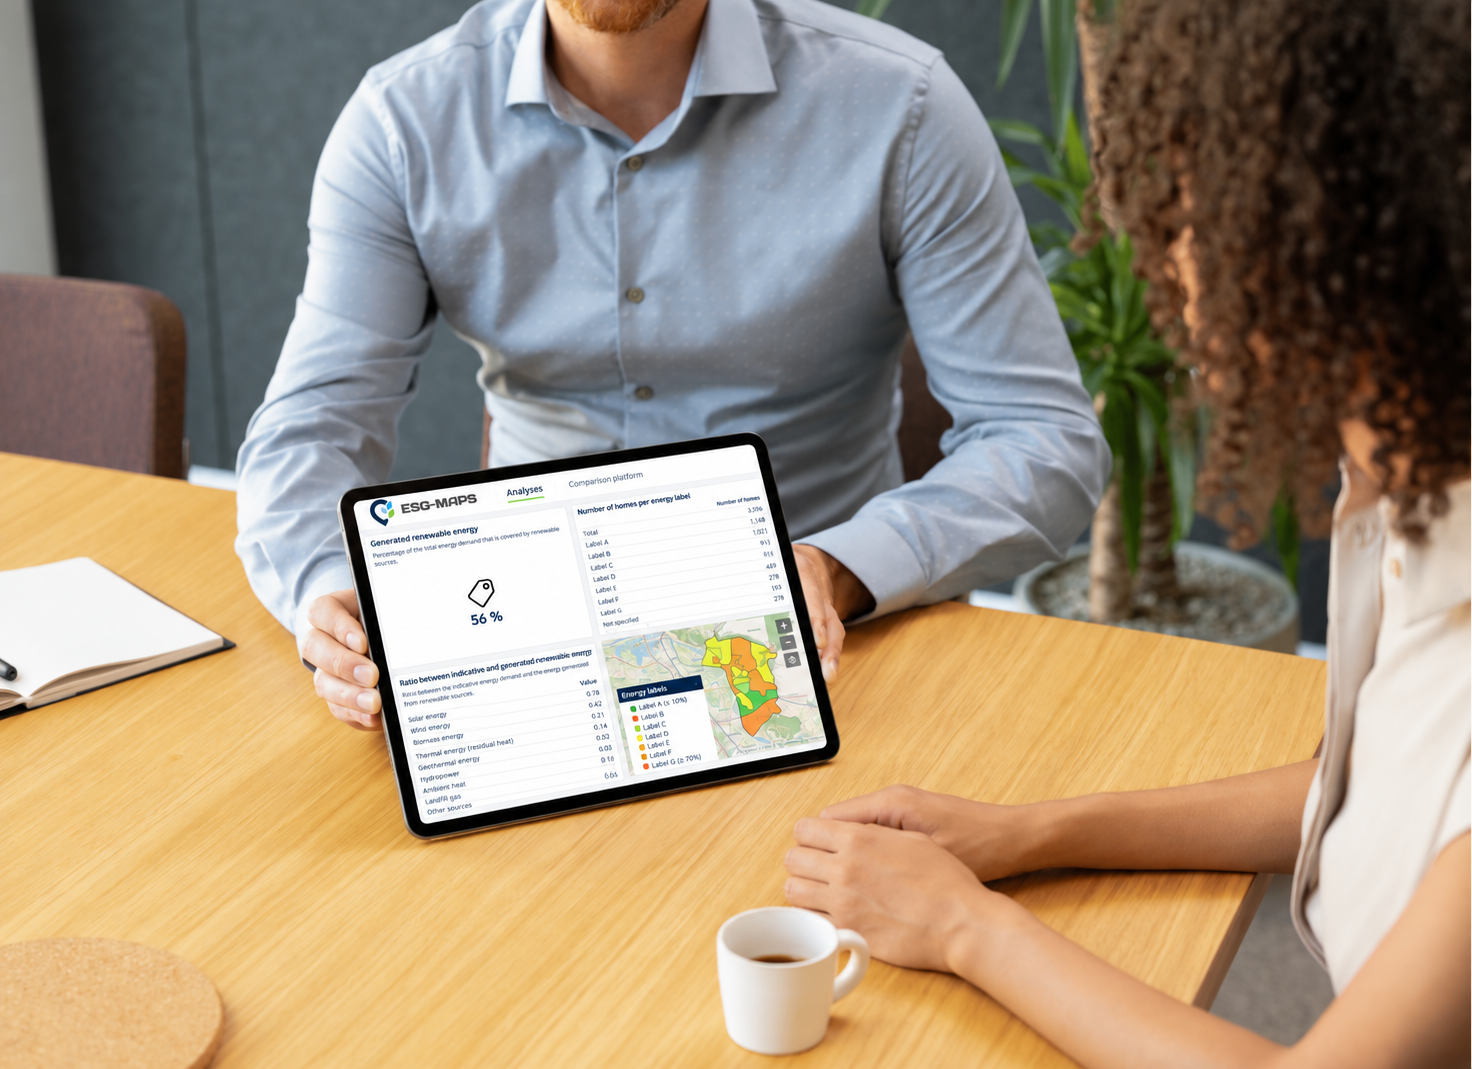
Policy teams can use spatial information to identify patterns between neighbourhoods, monitor developments over time, compare sustainability indicators, explore opportunities and risks by location, prioritise measures and communicate findings to colleagues, management and residents.
Bringing datasets together also makes relationships easier to identify. Energy, mobility, climate adaptation, green space and spatial development may be managed as separate policy areas, but geographically they often influence the same locations. A shared spatial environment helps municipalities see those connections more clearly.
From visualisation to policy instrument
Public sustainability maps remain valuable for residents and other stakeholders because they make complex subjects easier to understand and show what sustainability means at neighbourhood, street or building level. For municipalities, however, much of the long-term value sits behind the visualisation.
When the underlying datasets remain current and can be combined, filtered and analysed, the same environment can support both communication and policy. A municipality might first identify where heat stress is highest and then compare those locations with green-space indicators, vulnerable neighbourhoods or planned projects. The map becomes the starting point for a policy question rather than simply the final output.
The same principle applies to solar energy, insulation, climate adaptation and other sustainability themes. The goal is not simply to put more data on a map. It is to make that data easier to turn into decisions.
Why a service model matters
Sustainability policy operates in a changing landscape. New information becomes available, regulations and objectives develop, local conditions change and municipal teams need to answer questions that may not have existed when the original map or dashboard was created.
A one-off project can quickly become outdated if there is no process for maintaining it. With Sustainability-as-a-Service, the focus shifts from delivering a single application to maintaining a useful sustainability information environment over time.
This allows municipalities to build on an existing foundation instead of starting from scratch whenever a new policy question appears. Data, maps, dashboards and analyses can evolve alongside the organisation's sustainability priorities.
Connect data, maps and decision-making
The real value of sustainability data appears when data, spatial analysis and policy context connect. Data explains what is happening, spatial analysis reveals where it is happening, and policy context helps determine what should happen next.
When these elements sit in separate systems, policymakers spend valuable time gathering and interpreting information before they can address the actual policy question. Bringing them together creates a more practical working environment where teams can focus on questions such as which neighbourhoods should be prioritised, where sustainability measures are already having an effect, which areas face multiple climate or energy challenges and where additional analysis may be required.
This is the difference between simply having sustainability data and being able to work effectively with sustainability data.
A stronger foundation for municipal sustainability policy
Municipalities already have access to a large amount of information. The next step is not necessarily collecting more. It is creating greater coherence between what is already available.
By connecting datasets, spatial analysis, maps, dashboards and reporting, sustainability information can become part of everyday policy development rather than remaining locked inside separate projects. Sustainability-as-a-Service provides a framework for keeping that information environment useful as both the data and policy questions continue to change.
From separate datasets to shared insight. From shared insight to better-informed decisions.
Ready to turn sustainability data into policy insight?