Spatial Heat Risk Analysis: Prioritising Cooling Where Heat and Vulnerability Overlap
Urban heat risk is not determined by temperature alone. Spatial heat risk analysis combines heat, shade, green space, cool places and vulnerability data to help municipalities identify where residents face the greatest risk and where cooling measures may have the most impact.
A temperature map can show where the city is hottest. However, the hottest location is not always the location where heat creates the greatest risk. A neighbourhood with high surface temperatures may still have trees, shaded walking routes and nearby green space, while another area may be only slightly cooler but have extensive paving, little vegetation and residents who are more vulnerable to prolonged heat.
For municipalities, that distinction is crucial because effective climate adaptation requires more than mapping temperature. Instead, it requires understanding where heat exposure, limited cooling opportunities and social vulnerability overlap spatially. Spatial heat risk analysis brings those factors together in one GIS-based view. As a result, ESG Maps Heat Insight can help municipalities compare temperature, green space, shade, cool places and vulnerability indicators within the same spatial context and make more targeted decisions about where cooling interventions may be needed most.
The hottest place is not always the place suffering most.
Urban heat is strongly influenced by the built environment. Roads, buildings and paved public spaces absorb and retain heat, while neighbourhoods with fewer trees, less shade and limited green space offer fewer opportunities for residents to cool down. However, temperature alone does not explain who is most exposed or where the consequences may be greatest.
A stronger spatial assessment therefore looks beyond heat itself. It can also consider paved surfaces, existing greenery and water, shaded and unshaded routes, access to cooler places and locations used by vulnerable residents. By layering these datasets in a GIS environment, municipalities gain a more complete understanding of how heat is experienced from one neighbourhood to another.
Consequently, they can distinguish between areas that are simply warm and areas where high temperatures may have a greater impact on health, accessibility and quality of life. The question then shifts from “Where is it hottest?” to the more meaningful “Where do heat exposure and vulnerability create the greatest risk?”
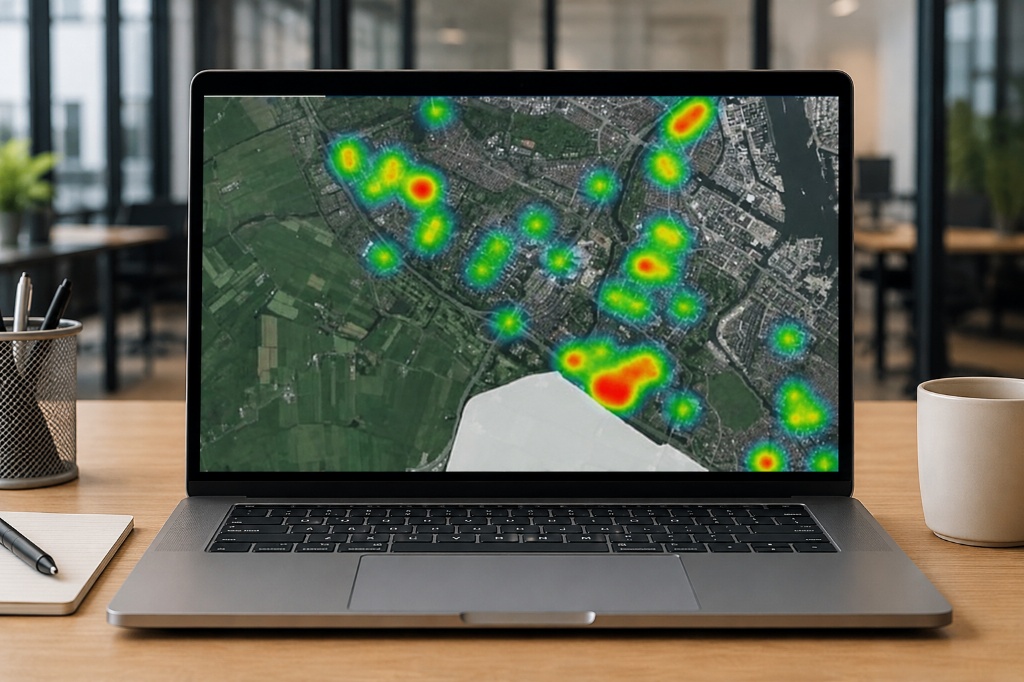
Spatial heat risk analysis showing urban heat patterns and climate vulnerability indicators in ESG Maps
When every neighbourhood needs attention, the hardest decision is where to act first.
Municipalities rarely have the capacity, budget or available space to implement every climate-adaptation measure at once. Therefore, prioritisation is unavoidable. One neighbourhood may benefit most from additional street trees and shaded walking routes, while another may need more accessible public green space, reduced paving or a cooler design for a square, school environment or residential street.
In other locations, water, temporary shading or other interventions may complement longer-term greening. Spatial heat risk analysis helps make those differences visible by comparing heat with greenery, water, shade, the built environment and vulnerable groups. As a result, municipalities can investigate which locations face the strongest combination of risk factors and which interventions may be most relevant there.
This creates a stronger basis for prioritisation than simply selecting the hottest point on a temperature map. Instead, municipalities can focus on places where one intervention may address several risk factors at once and where the potential benefit for residents is likely to be more meaningful.
Heat does not stop at the edge of one policy department.
Measures that reduce heat often influence several other municipal priorities at the same time. Additional vegetation may improve biodiversity and water retention, while reducing paving can support infiltration as well as limit heat accumulation. At the same time, changes to walking routes, public spaces and green infrastructure can influence accessibility, mobility and neighbourhood quality.
For that reason, spatial heat risk analysis works best when it is connected to broader climate-adaptation and urban-planning data. Departments responsible for public health, spatial planning, green-space management and infrastructure may all look at the same neighbourhood from different perspectives, yet they are often responding to the same physical environment.
A shared GIS view can therefore help reveal where those priorities overlap. ESG Maps brings heat, green-space and wider climate-adaptation data together so that related challenges can be assessed in context rather than through disconnected maps and datasets. In practice, that makes it easier to move from separate departmental questions towards one shared understanding of where intervention is most urgent.
Knowing where the risk is today is only half the story.
Heat adaptation does not end once a municipality identifies priority areas. Teams also need to understand whether conditions improve over time and whether implemented measures are producing the intended effect. Therefore, spatial heat risk analysis becomes more valuable when it forms part of an ongoing monitoring process.
Periodic data updates can help municipalities compare neighbourhoods, identify changes and communicate progress to administrators, project partners and residents. ESG Maps Heat Insight uses periodically updated information, including satellite and weather data, to support longer-term spatial analysis rather than functioning only as an acute heat-alert tool.
Moreover, visualising the underlying risk factors makes decisions easier to explain. Municipalities can show why a particular neighbourhood has been prioritised, which spatial conditions contributed to that decision and how proposed interventions relate to heat, shade, green space and vulnerability. As a result, climate policy can move from broad ambition towards visible, location-based choices that are easier to justify and communicate.
Better heat policy starts where heat becomes a human problem.
A municipality can know that summers are becoming hotter and still struggle to decide where investment should go first. Spatial heat risk analysis provides the missing geographical context by connecting temperature with the conditions that shape how people actually experience heat.
When municipalities combine heat exposure, green space, shade, cool places, accessibility and vulnerability, they gain a stronger basis for prioritising interventions and connecting heat policy with wider climate-adaptation goals. Ultimately, the objective is not simply to create a more detailed heat map. It is to identify where heat becomes a greater risk, understand why and determine where spatial interventions could make the greatest difference.
Want to identify where heat exposure and vulnerability overlap in your municipality?
ESG Maps Heat Insight helps organisations analyse heat-sensitive areas, cooling opportunities and climate-adaptation priorities within one spatial environment.