

Nearly 200 map layers across 13 themes now come together in Rotterdam’s Wijkatlas. See how the city used GeoApps to reduce fragmented information, connect neighbourhood challenges and give teams one shared spatial view for faster decisions.
A city does not usually suffer from a lack of data. The harder problem is knowing where the right information is, who owns it and what else is happening in the same place.
For a large organisation such as the City of Rotterdam, a seemingly simple question about one location could trigger a chain of emails, phone calls and conversations between departments. One team knew about a planned development. Another held information about underground infrastructure. Somewhere else, climate, demographic or energy data could reveal another constraint entirely.
Rotterdam wanted to shorten that search. The result was the Wijkatlas, a shared spatial environment built with GeoApps that brings neighbourhood information together and makes it easier for teams to understand what is happening in an area before decisions move forward. The initiative started at the end of 2023, and the pilot environment was subsequently used for more than a year by over 120 pilot users.
Large municipalities naturally develop specialist datasets, reports and applications across departments. Each may work well on its own, but problems appear when several policy challenges meet in the same neighbourhood.
Consider something as practical as choosing a location for a charging point or underground waste container. Before a project moves forward, teams may need to understand planned construction, public-space projects, underground cables, demographic developments or other initiatives already affecting the site.
Without a shared overview, that context depends heavily on knowing the right colleague or opening the right system. Rotterdam designed the Wijkatlas to make that first exploration much faster. Users can start with a visual overview of a neighbourhood and then move deeper into viewers, dashboards and spatial analysis when more detail is needed.
The goal was not another map. It was a quicker route from “Who knows this?” to “Here is what we already know.”
Today, the Wijkatlas brings together nearly 200 map layers across 13 themes, including demography, water, climate, underground infrastructure and energy. Instead of viewing those subjects as separate policy worlds, teams can combine layers and explore how different challenges overlap geographically.
That matters because neighbourhoods do not experience policy in departments. Climate adaptation can affect public-space design. Housing development can influence mobility and infrastructure. Energy projects compete for space with other neighbourhood priorities.
By placing those themes in one spatial environment, policymakers can compare information, discover relationships and build a more integrated understanding of an area without requiring every user to become a GIS specialist.
Different teams can keep their expertise. The Wijkatlas gives them a shared place to see how their work connects.
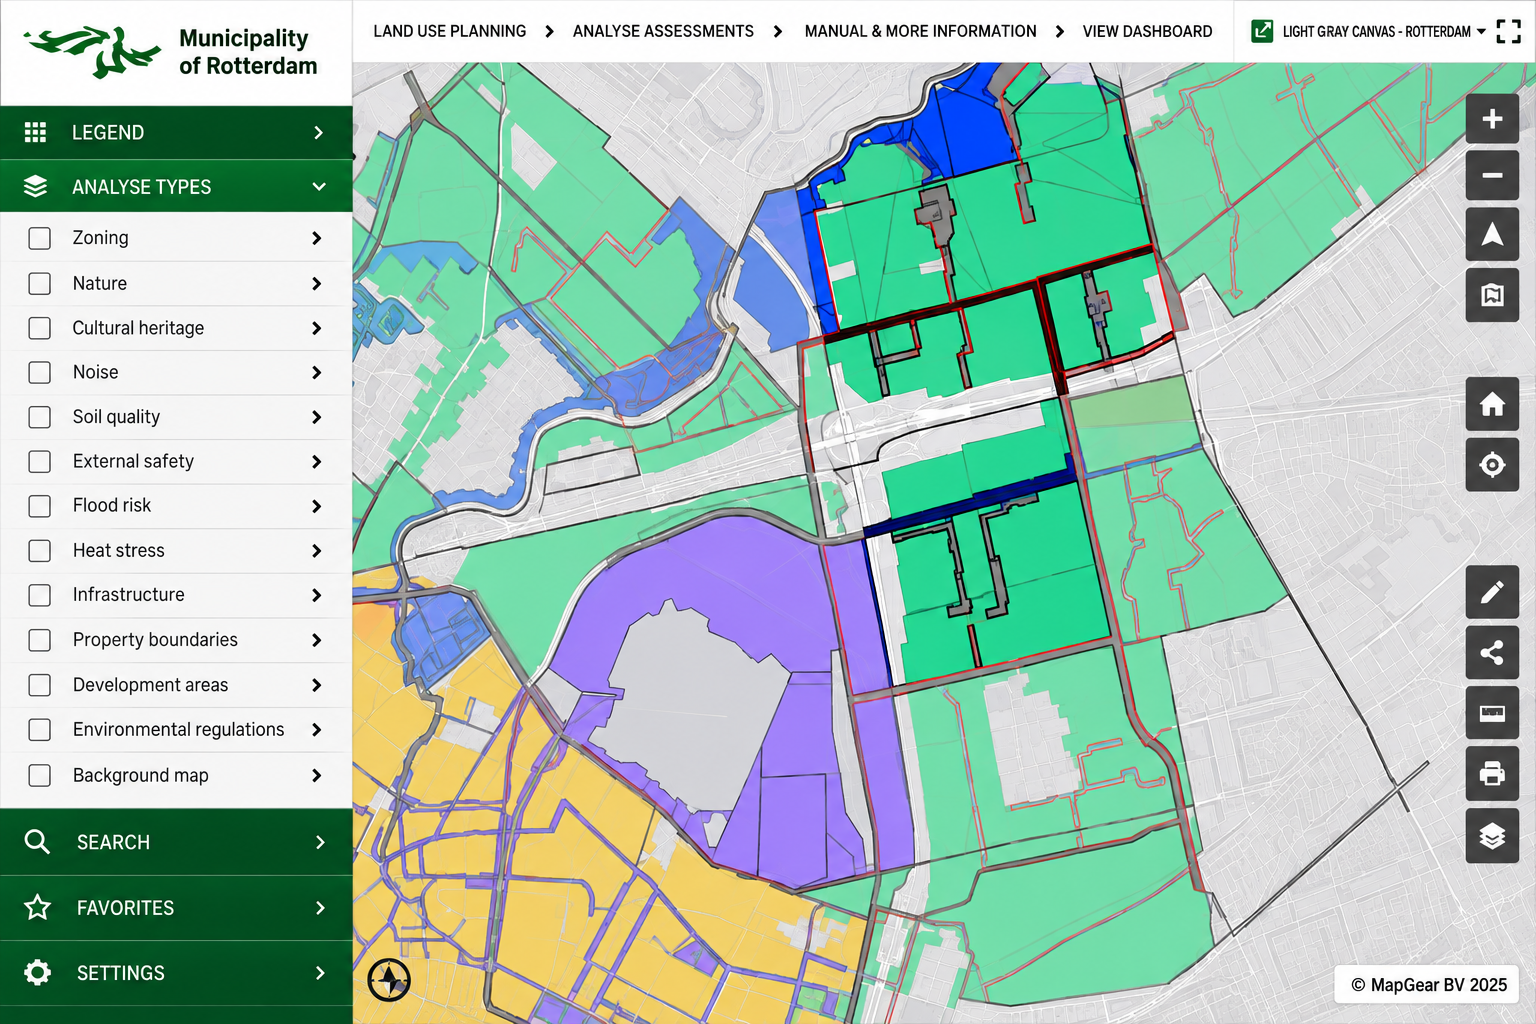
Rotterdam Wijkatlas combining land-use, environmental and infrastructure themes in one GeoApps map environment
Rotterdam first introduced the Wijkatlas as a pilot. More than 120 users worked with the environment for over a year, while workshops and instructional material helped more departments adopt it. As additional teams joined and contributed their own maps, the municipality gained practical insight into what a long-term solution needed to provide.
Those lessons included straightforward but important capabilities such as easily sharing map views and combining several layers during discussions. The pilot therefore became more than a technical proof of concept. It helped Rotterdam clarify its organisational requirements before tendering for the full implementation.
GeoApps was subsequently selected again as the GIS platform provider for the longer-term solution, with the current case study stating a five-year period.
Sometimes the most valuable result of a pilot is not proving that a platform works. It is discovering what the organisation needs in order to work better.
The value of the Wijkatlas is not simply that more datasets can be displayed on one screen. It is that spatial information becomes easier to use across teams.
During meetings and project kick-offs, colleagues can bring relevant maps together instead of first reconciling separate reports. Challenges become visible in their geographic context, and specialist information can be shared with people who do not work in GIS every day.
GeoApps supports that approach with an accessible 2D and 3D viewing environment while allowing administrators to manage data, maps and integrations behind the scenes. The result is a GIS environment designed for two different needs at once: control for the people managing the information and simplicity for the people who need to use it.
For Rotterdam, that creates a stronger foundation for neighbourhood-focused working. Nearly 200 spatial layers no longer have to represent nearly 200 separate conversations.
A shared map does not remove the complexity of a city. It gives people one place to understand that complexity together.
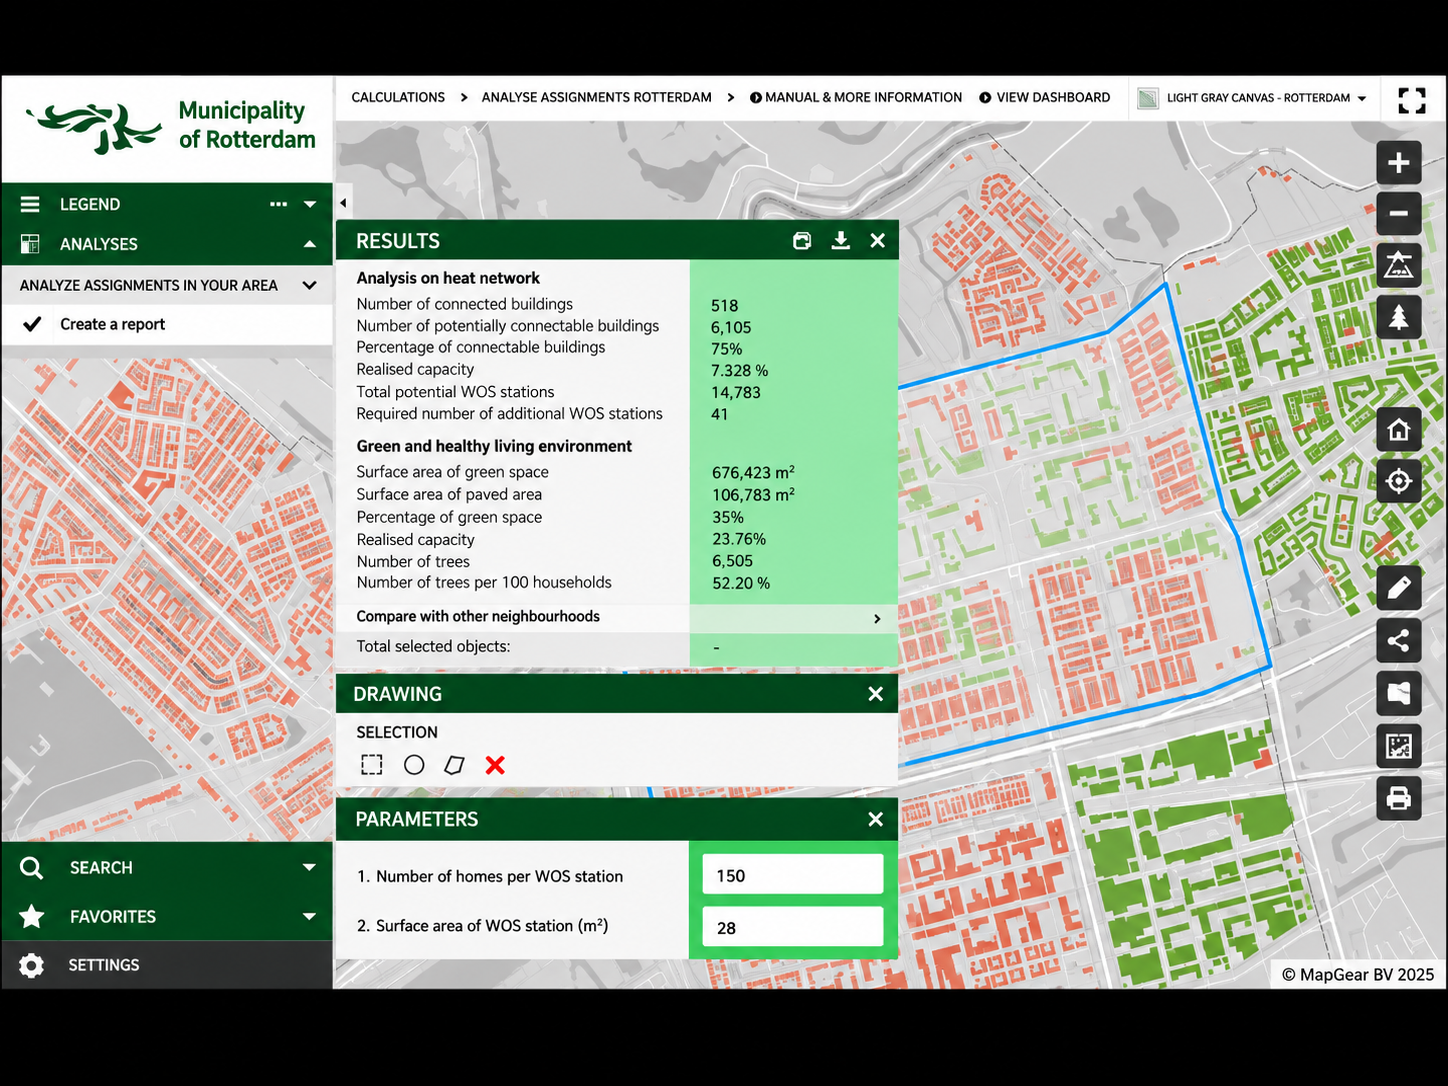
GeoApps analysis in Rotterdam showing heat-network potential, green-space indicators and neighbourhood results
GeoApps helps municipalities bring spatial data, policy maps and workflows together in accessible applications, so teams can spend less time searching for information and more time using it.
Let's discuss how GeoApps can help bring your vision to life
Let's discuss your use case.

