


How do you measure rooftop solar progress across an entire region? GeoApps helped the Utrecht Regional Energy Strategy, formerly known as RES U16, turn aerial imagery and building-level analysis into a spatial picture of around 700,000 detected solar panels.
Climate targets are easy to put into a strategy. Measuring what is actually happening across thousands of streets, buildings and rooftops is much harder. That was the challenge for the Utrecht Regional Energy Strategy, formerly known as RES U16, which needed a clearer picture of how rooftop solar was developing across the region.
For international readers, RES stands for Regional Energy Strategy. In the Netherlands, these regional partnerships coordinate plans for renewable electricity and sustainable heat. The Utrecht energy region brings together 16 municipalities, four water authorities, the Province of Utrecht and regional grid operator Stedin. The former name “RES U16” referred to the 16 municipalities involved; the partnership is now referred to as RES Regio Utrecht.
The partnership needed more than regional totals. It needed to understand which buildings already had solar panels, where adoption was progressing and where additional rooftop potential remained. GeoApps helped turn that question into something visible by analysing solar installations spatially and creating a regional picture of around 700,000 detected solar panels.
Solar adoption does not develop evenly. One neighbourhood may already have widespread rooftop installations, while another still contains large areas of unused potential. Looking only at one regional total can hide those differences and make it harder to understand where additional action may be useful.
The Utrecht Regional Energy Strategy therefore needed insight at a much more practical level. By connecting detected solar installations to buildings and locations, the region could move from a general estimate of renewable-energy growth to a spatial view of where that transition was actually taking place.
That distinction matters because the regional strategy is intended to coordinate how the Utrecht region contributes to the transition from fossil energy towards renewable electricity and sustainable heat. The partnership has used spatial planning to identify opportunities for solar and wind energy across the participating municipalities.
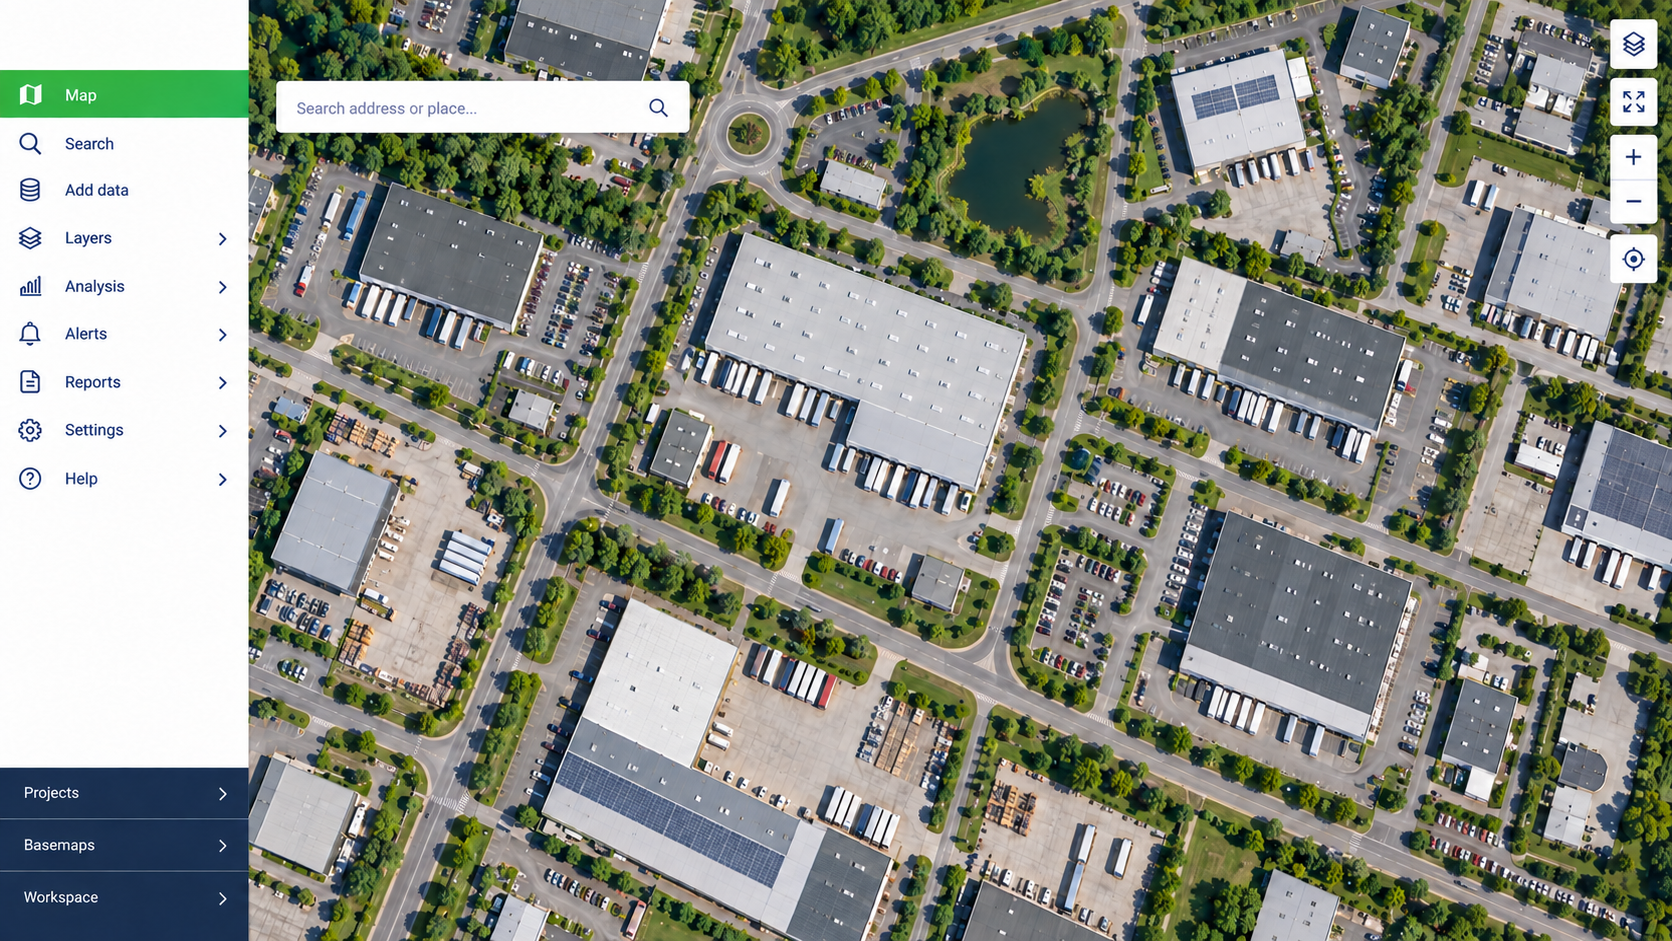
Aerial imagery used to analyse buildings and rooftop solar potential across the Utrecht region
Detecting hundreds of thousands of solar panels created more than an impressive headline. It provided a spatial baseline that could be compared with rooftop potential and used to understand how solar adoption was developing across different municipalities and neighbourhoods.
Instead of treating rooftop solar as a single number in a progress report, teams could see where installations were concentrated and where the difference between realised solar and potential remained larger. That makes monitoring more useful because the conversation can shift from “How many panels do we have?” to “Where is progress happening, and where might more attention be needed?”
Monitoring is an explicit part of the regional collaboration. The Utrecht energy partnership describes progress monitoring as important for steering, coordination and decision-making as the regional energy strategy develops.
Analysing rooftop solar across an entire region means working with thousands of buildings and a large geographic area. Without a structured workflow, that quickly becomes difficult to manage consistently.
GeoApps provides the spatial environment in which the analysis can be organised geographically rather than as a disconnected administrative exercise. Observations remain connected to their location, which makes it easier to combine results, review progress and maintain one regional picture instead of separate files for different areas.
This is particularly valuable for a partnership involving multiple municipalities and public organisations. Each organisation may have its own policy responsibilities, but the regional strategy requires them to understand progress at a scale that extends beyond municipal boundaries. The current Utrecht energy partnership still consists of the 16 municipalities, four water authorities, the Province of Utrecht and Stedin.
A count of solar panels shows how much has already happened. A spatial dataset makes it possible to ask more useful questions. Which neighbourhoods are moving faster? Where is rooftop potential still largely unused? Where could policy, communication or investment require more attention?
That turns monitoring into something more actionable. Municipalities can compare realised solar with local opportunity, while the regional partnership can see how progress differs across the wider area instead of assuming every municipality is developing at the same pace.
The Utrecht Regional Energy Strategy continues to be updated as circumstances, technology, regulation and spatial priorities change. The regional partnership explicitly uses these updates to maintain a current picture of progress and future renewable-energy development.
Around 700,000 panels are a statistic. Knowing where they are turns that statistic into spatial insight that can support the next decision.
GeoApps helps governments and regional organisations turn large environmental and energy datasets into practical spatial insight for monitoring, comparison and decision-making.
Let's discuss how GeoApps can help bring your vision to life

Let's discuss your use case.

