“Des calculs qui nous prenaient une semaine sont maintenant terminés en quelques minutes. Cela nous fait gagner énormément de temps et d’argent.”
Local insulation on the map
ESG Maps brings energy labels, building characteristics and neighbourhood patterns together so Dutch municipalities can prioritise local insulation approaches — without claiming a subsidy calculator or project tracker the map does not provide.
Plus d’informations
Des calculs qui nous prenaient une semaine sont maintenant terminés en quelques minutes. Cela nous fait gagner énormément de temps et d’argent.
Harry de Brauw
Conseiller transition énergétique
La confiance des communes, provinces et organisations aux Pays-Bas et en Belgique























































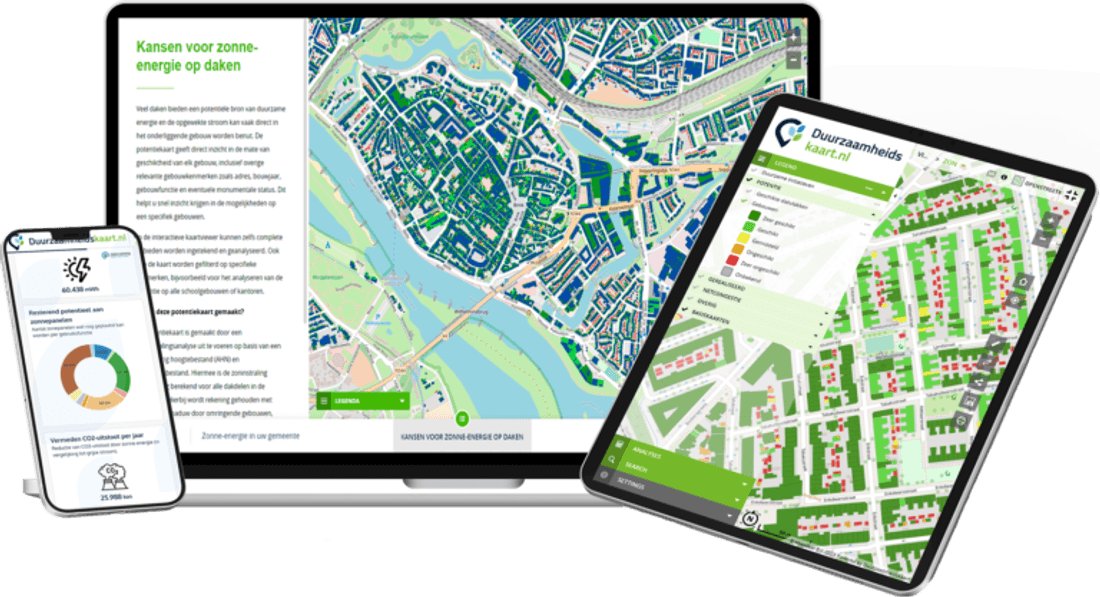
Insulation is often the first step in making homes more energy-efficient. A city-wide average hides where older stock, weaker labels and energy poverty actually sit. The map makes those differences usable for a neighbourhood approach.
Labels
EP-online & BAG
Neighbourhoods
Compare and prioritise
Policy
Local insulation approach
Residents
Clearer targeting
Policy officers and advisers see energy labels and indicative insulation potential per home or neighbourhood. Filter by housing type, construction year and ownership so you can see where a local approach is most worthwhile — and where to combine insulation with heat or solar-on-roof.
Combine energy labels, housing type and construction year to prioritise insulation opportunities for neighbourhood plans, housing associations and resident communication. The map supports targeting; it does not replace an energy adviser or a subsidy application.
Dutch municipalities use local insulation approaches to help homeowners take the first step. The map shows where that work is concentrated. Subsidy schemes such as LAI and ISDE remain the responsibility of the schemes themselves; the map helps you see where communication and targeting make sense.
Insulation is often the first practical step before heat-network choices or solar-on-roof. The map shows where weaker labels and older stock cluster.
Filter by neighbourhood, home type and ownership so you can plan block-by-block work with housing associations and residents — not a municipality-wide slogan.
Homeowners still apply via official schemes. You use the map to see where information and outreach are most needed, not to auto-calculate entitlements.
Spatial insight for a local insulation approach. Not a resident portal, not automatic delivery monitoring, not a subsidy calculator.
Official labels with building characteristics so you can see improvement potential per home or neighbourhood.
See where a neighbourhood or housing-association programme is most worthwhile.
Use maps to explain why a neighbourhood is in scope — without storing extra personal data you do not need.
Insulation sits next to heat, solar and green so you do not run a separate spreadsheet for each theme.
Exemple · Gennep
La commune voulait maîtriser les étiquettes énergétiques, les caractéristiques des bâtiments et l’approche locale d’isolation. ESG Maps rend la tâche visible par bâtiment et quartier — et enregistre les progrès.
Lire le projet GennepGennep pilote l’isolation des logements par quartier et propriété

01 / 02
Une commune limbourgeoise sur la Meuse
Gennep a choisi la plateforme pour piloter l’isolation, pas seulement la mesurer.
Current page
Home insulation sits in the ESG Maps platform with heat, solar and other sustainability layers, so a local insulation approach is not a separate silo.
Home insulation
Expériences d’organisations qui travaillent avec ESG Maps.
“Des calculs qui nous prenaient une semaine sont maintenant terminés en quelques minutes. Cela nous fait gagner énormément de temps et d’argent.”
“Les promoteurs investissent beaucoup dans la végétalisation, mais il était difficile de voir ce que cela apportait vraiment dans le tableau d’ensemble. Grâce à la nouvelle analyse, nous avons pu établir pour la première fois un bilan vert concret.”

“Nous présentons notre expertise sous forme d’applications cartographiques interactives, et non de rapports austères. Même sans connaissances techniques, les équipes peuvent s’en servir - ESG-Maps est une base essentielle pour l’élaboration des politiques.”
“ESG-Maps nous a aidés à rendre les données de durabilité accessibles à tous. La plateforme allie une visualisation puissante à une expérience utilisateur simple.”
“Avec MapGear (ESG-Maps), nous avons établi une prévision réaliste du potentiel solaire à Groningen pour 2035 - en combinant données sur toitures, pompes à chaleur, mobilité électrique et choix politiques.”

“Avec MapGear (ESG-Maps), nous avons développé le TransitiePlanner pour l’énergie, l’adaptation climatique et la mobilité. Nous constituons un dossier dynamique pour les zones d’activités durables.”

“ESG-Maps nous a aidés à planifier et réaliser nos projets de transition énergétique plus efficacement.”
“Avec Asbestdakenkaart, nous avons enfin une vue d’ensemble de nos données amiante et de l’avancement des travaux de désamiantage. Un seul endroit pour prioriser, suivre et rendre compte.”
“Des calculs qui nous prenaient une semaine sont maintenant terminés en quelques minutes. Cela nous fait gagner énormément de temps et d’argent.”
“Les promoteurs investissent beaucoup dans la végétalisation, mais il était difficile de voir ce que cela apportait vraiment dans le tableau d’ensemble. Grâce à la nouvelle analyse, nous avons pu établir pour la première fois un bilan vert concret.”
“Nous présentons notre expertise sous forme d’applications cartographiques interactives, et non de rapports austères. Même sans connaissances techniques, les équipes peuvent s’en servir - ESG-Maps est une base essentielle pour l’élaboration des politiques.”
“ESG-Maps nous a aidés à rendre les données de durabilité accessibles à tous. La plateforme allie une visualisation puissante à une expérience utilisateur simple.”
“Avec MapGear (ESG-Maps), nous avons établi une prévision réaliste du potentiel solaire à Groningen pour 2035 - en combinant données sur toitures, pompes à chaleur, mobilité électrique et choix politiques.”
“Avec MapGear (ESG-Maps), nous avons développé le TransitiePlanner pour l’énergie, l’adaptation climatique et la mobilité. Nous constituons un dossier dynamique pour les zones d’activités durables.”
“ESG-Maps nous a aidés à planifier et réaliser nos projets de transition énergétique plus efficacement.”
“Avec Asbestdakenkaart, nous avons enfin une vue d’ensemble de nos données amiante et de l’avancement des travaux de désamiantage. Un seul endroit pour prioriser, suivre et rendre compte.”
Request a demo to see energy labels and neighbourhood priorities on your own municipal area.
Answers about Home Insulation.
We combine official energy labels (EP-online) with BAG and building characteristics. Where extra sources are available they can be added. That supports an indication of insulation potential per home or neighbourhood — not a guaranteed saving per address.
Yes. You filter by neighbourhood, home type, label and ownership. That helps you prioritise areas and discuss insulation alongside heat or solar-on-roof with housing associations and residents.
No. Official subsidy schemes stay with the issuing authorities. The map helps you see where insulation is likely relevant so you can target information; homeowners still apply through the official channels.
We only process data that may be used for this purpose (including labels and BAG). For policy and reporting we work with aggregated or anonymised views where that is appropriate. Processing follows GDPR.
Contact
Des questions sur nos produits ? Démo ou devis ? Remplissez le formulaire — nous vous répondons.
Remplissez le formulaire et nous vous répondons sous 24 h, ou réservez .