“Les promoteurs investissent beaucoup dans la végétalisation, mais il était difficile de voir ce que cela apportait vraiment dans le tableau d’ensemble. Grâce à la nouvelle analyse, nous avons pu établir pour la première fois un bilan vert concret.”
Green-roof potential for residents and policy
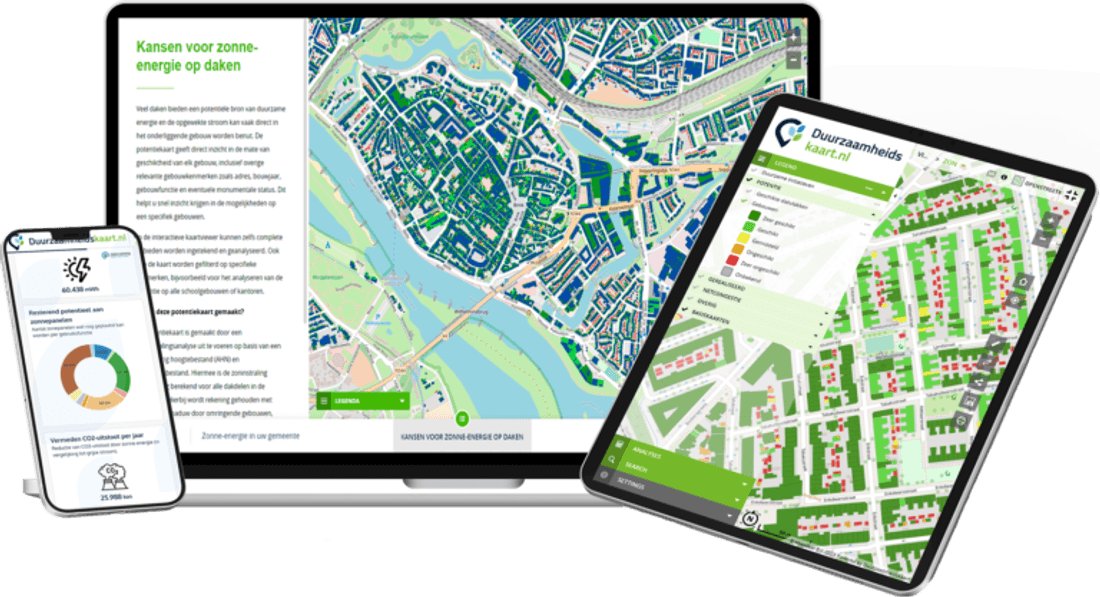
The green roof map helps Dutch municipalities and water authorities show residents whether a roof suits extensive (sedum) or intensive greening — and put that next to solar and other roof layers.
Plus d’informations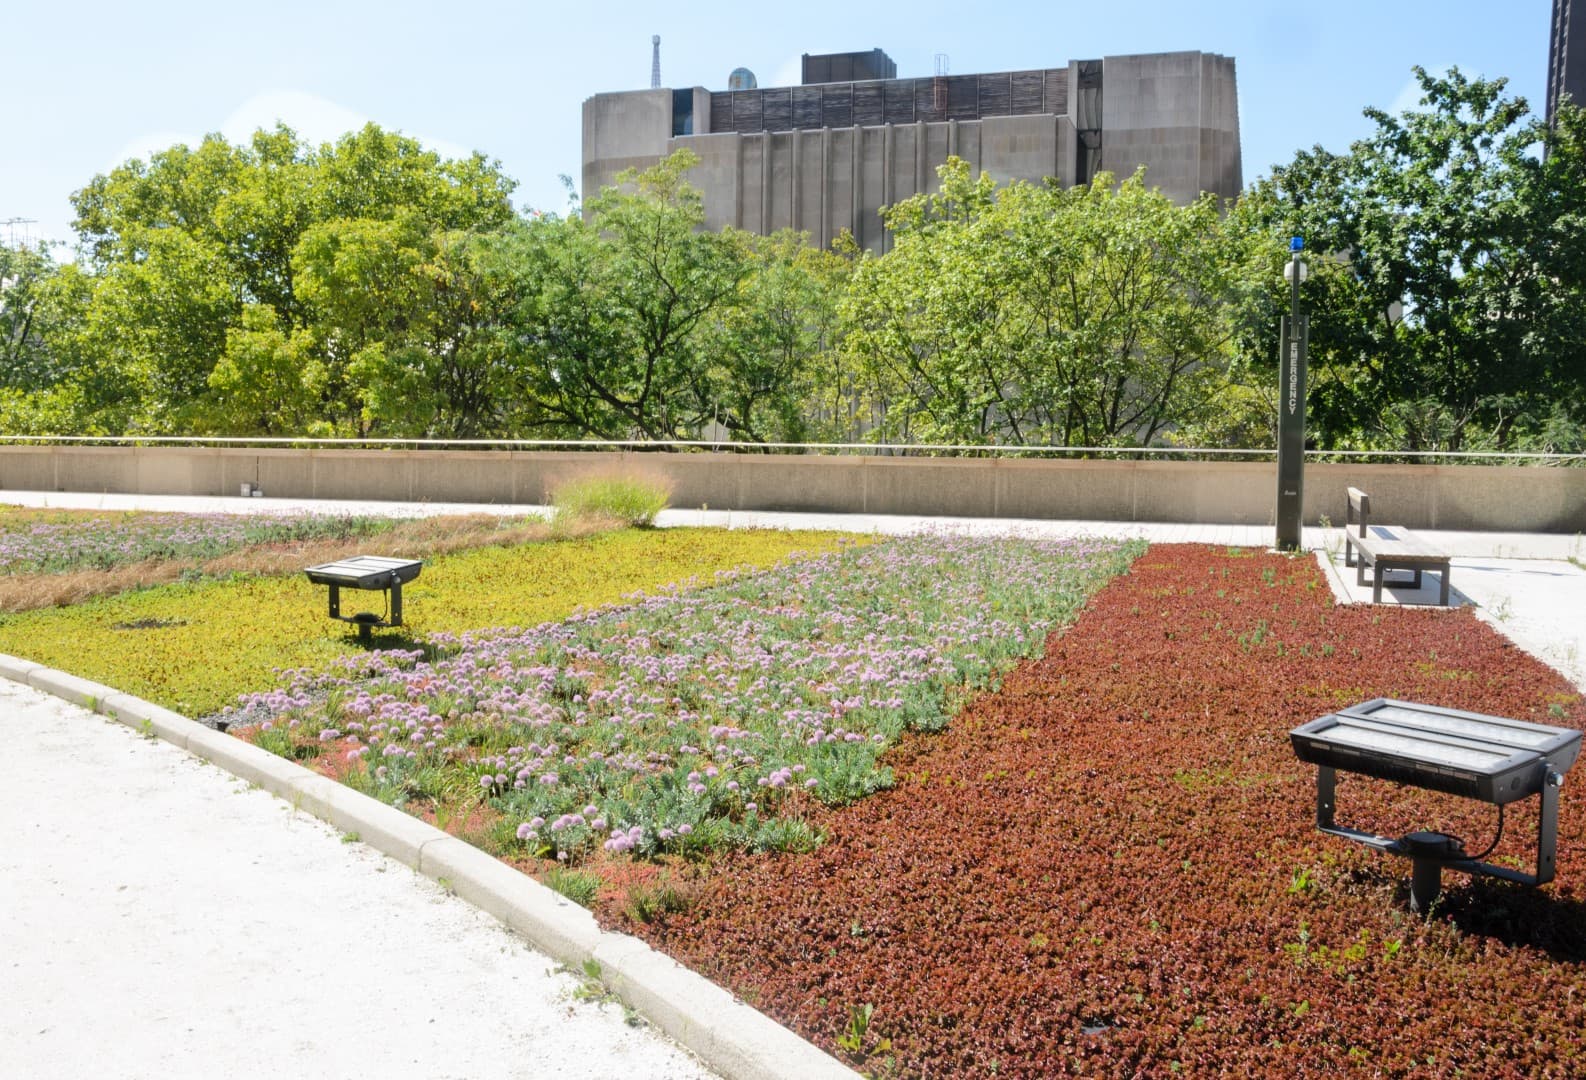
La confiance des communes, provinces et organisations aux Pays-Bas et en Belgique






































Green roofs can hold rainwater, add vegetation in dense neighbourhoods and last longer than a bare covering. Residents often do not know what their roof can carry. A public map lowers that barrier without pretending every roof is a garden.
Water
Retention on the roof
Living environment
More green in the city
Roof types
Sedum to roof garden
Policy
Greening you can show
Residents enter an address and see an indication of roof suitability and which type of green roof may fit. Municipalities and water authorities use the same picture for communication and, where they offer a scheme, to point people to subsidy information — the map does not replace a structural survey.
Show potential per roof surface, explain extensive versus intensive, and keep solar and asbestos layers in the same platform so roof choices are not three separate websites.
Practice example · Leiden
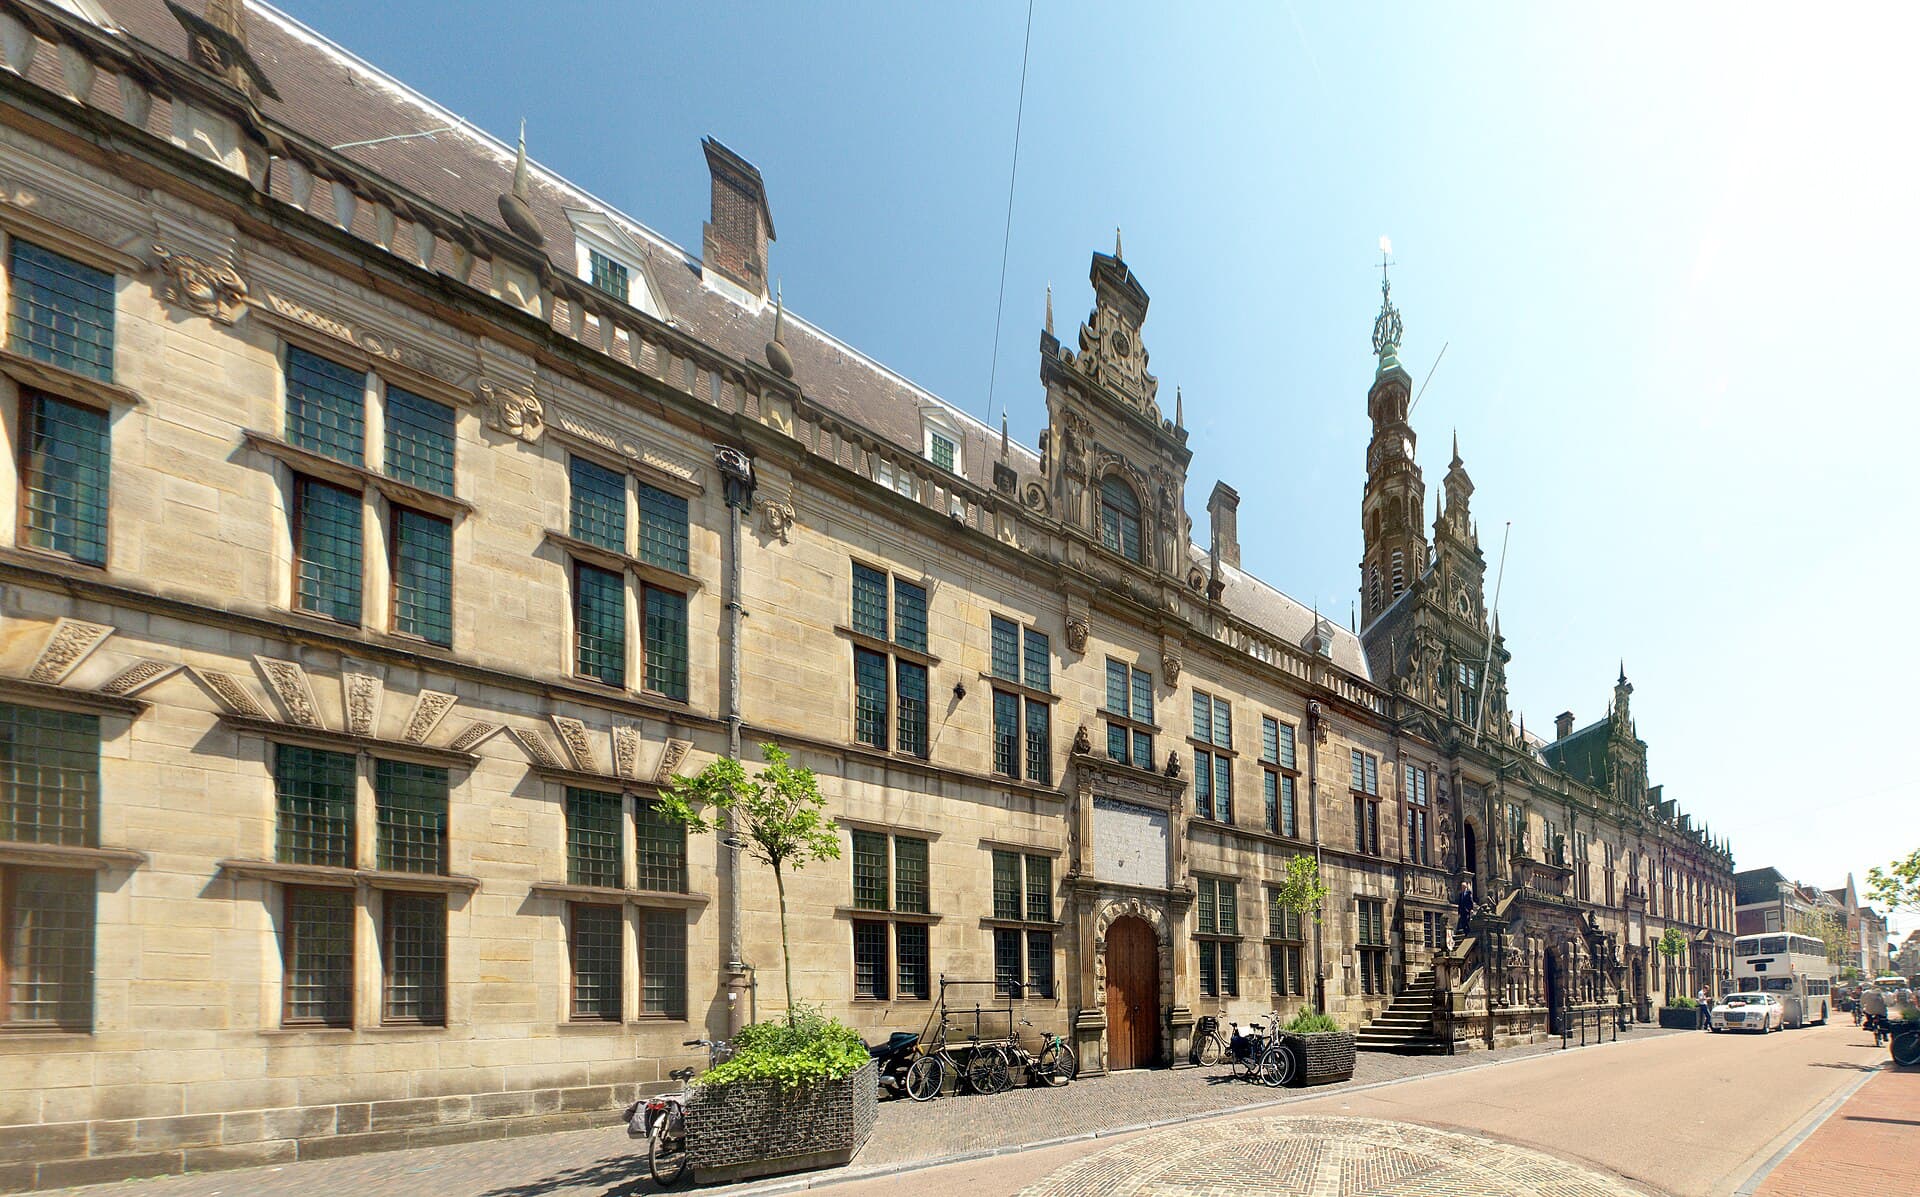
The Dutch municipality of Leiden wanted one public map for sustainable roof choices. Residents can explore solar-on-roof and, in the same environment, see opportunities for green roofs — instead of scattered datasets for policy and citizens.
Read the Leiden caseLeiden put green roofs next to solar for residents
01 / 02
One municipality, one public map
Leiden brought solar, green roofs and spatial insight together for residents and policymakers.
Green roofs contribute to rainwater retention and a greener living environment. The map shows what may be possible; design and construction still need a roof specialist.
Lightweight vegetation such as sedum, herbs, moss and grass. Typically used where load-bearing capacity is limited.
A heavier roof garden with shrubs or trees, walkable as outdoor space. Needs a stronger structure and more maintenance.
Substrate and roots can hold rain and release it more slowly, which can ease pressure on sewers during heavy showers.
A typical build-up includes waterproofing, protection, drainage, filter, substrate and vegetation. Systems differ; the map is an indication, not a construction drawing.
A public or policy map of green-roof potential. Not an automatic subsidy application and not a guaranteed euro saving per roof.
Per address or roof plane: an indication whether greening may be possible and which type fits.
Use the map in talks about pluvial flooding and neighbourhood greening.
Point residents to municipal or water-board information where you offer a subsidy. Applications stay with the scheme.
Green roofs sit next to the solar map and asbestos roof map in ESG Maps.
Current page
The green roof map is part of the ESG Maps platform. View green-roof potential alongside solar energy, asbestos roofs and other sustainability data.
Green roof map
Expériences d’organisations qui travaillent avec ESG Maps.
“Les promoteurs investissent beaucoup dans la végétalisation, mais il était difficile de voir ce que cela apportait vraiment dans le tableau d’ensemble. Grâce à la nouvelle analyse, nous avons pu établir pour la première fois un bilan vert concret.”
“Des calculs qui nous prenaient une semaine sont maintenant terminés en quelques minutes. Cela nous fait gagner énormément de temps et d’argent.”

“Nous présentons notre expertise sous forme d’applications cartographiques interactives, et non de rapports austères. Même sans connaissances techniques, les équipes peuvent s’en servir - ESG-Maps est une base essentielle pour l’élaboration des politiques.”
“ESG-Maps nous a aidés à rendre les données de durabilité accessibles à tous. La plateforme allie une visualisation puissante à une expérience utilisateur simple.”
“Avec MapGear (ESG-Maps), nous avons établi une prévision réaliste du potentiel solaire à Groningen pour 2035 - en combinant données sur toitures, pompes à chaleur, mobilité électrique et choix politiques.”

“Avec MapGear (ESG-Maps), nous avons développé le TransitiePlanner pour l’énergie, l’adaptation climatique et la mobilité. Nous constituons un dossier dynamique pour les zones d’activités durables.”

“ESG-Maps nous a aidés à planifier et réaliser nos projets de transition énergétique plus efficacement.”
“Avec Asbestdakenkaart, nous avons enfin une vue d’ensemble de nos données amiante et de l’avancement des travaux de désamiantage. Un seul endroit pour prioriser, suivre et rendre compte.”
“Les promoteurs investissent beaucoup dans la végétalisation, mais il était difficile de voir ce que cela apportait vraiment dans le tableau d’ensemble. Grâce à la nouvelle analyse, nous avons pu établir pour la première fois un bilan vert concret.”
“Des calculs qui nous prenaient une semaine sont maintenant terminés en quelques minutes. Cela nous fait gagner énormément de temps et d’argent.”
“Nous présentons notre expertise sous forme d’applications cartographiques interactives, et non de rapports austères. Même sans connaissances techniques, les équipes peuvent s’en servir - ESG-Maps est une base essentielle pour l’élaboration des politiques.”
“ESG-Maps nous a aidés à rendre les données de durabilité accessibles à tous. La plateforme allie une visualisation puissante à une expérience utilisateur simple.”
“Avec MapGear (ESG-Maps), nous avons établi une prévision réaliste du potentiel solaire à Groningen pour 2035 - en combinant données sur toitures, pompes à chaleur, mobilité électrique et choix politiques.”
“Avec MapGear (ESG-Maps), nous avons développé le TransitiePlanner pour l’énergie, l’adaptation climatique et la mobilité. Nous constituons un dossier dynamique pour les zones d’activités durables.”
“ESG-Maps nous a aidés à planifier et réaliser nos projets de transition énergétique plus efficacement.”
“Avec Asbestdakenkaart, nous avons enfin une vue d’ensemble de nos données amiante et de l’avancement des travaux de désamiantage. Un seul endroit pour prioriser, suivre et rendre compte.”
Request a demo and show residents which type of green roof may fit their address.
Answers about the green roof map.
Extensive usually means lightweight vegetation (sedum, herbs, moss, grass). Intensive means a heavier, walkable roof garden. The map indicates which type may be possible; a specialist still checks structure and detailing.
Some Dutch municipalities and water boards offer schemes. The map can point to information you configure. Check current conditions with the municipality or water board — the map does not award subsidy.
We combine roof planes, pitch and other available building information. The result is an indication, not a construction advice.
Yes. On ESG Maps you can use the green roof map together with solar and asbestos roof layers so residents and policy see roof options in one place. Leiden is an example of that combined public map.
Contact
Des questions sur nos produits ? Démo ou devis ? Remplissez le formulaire — nous vous répondons.
Remplissez le formulaire et nous vous répondons sous 24 h, ou réservez .