“Berekeningen waarvoor we vroeger een week nodig hadden, zijn nu in enkele minuten klaar. Dat bespaart ons enorm veel tijd én geld.”
Solar potential & policy
One data source, two uses: an accessible Solar Map for residents and Solar Map Pro for policy, reporting and RES monitoring.
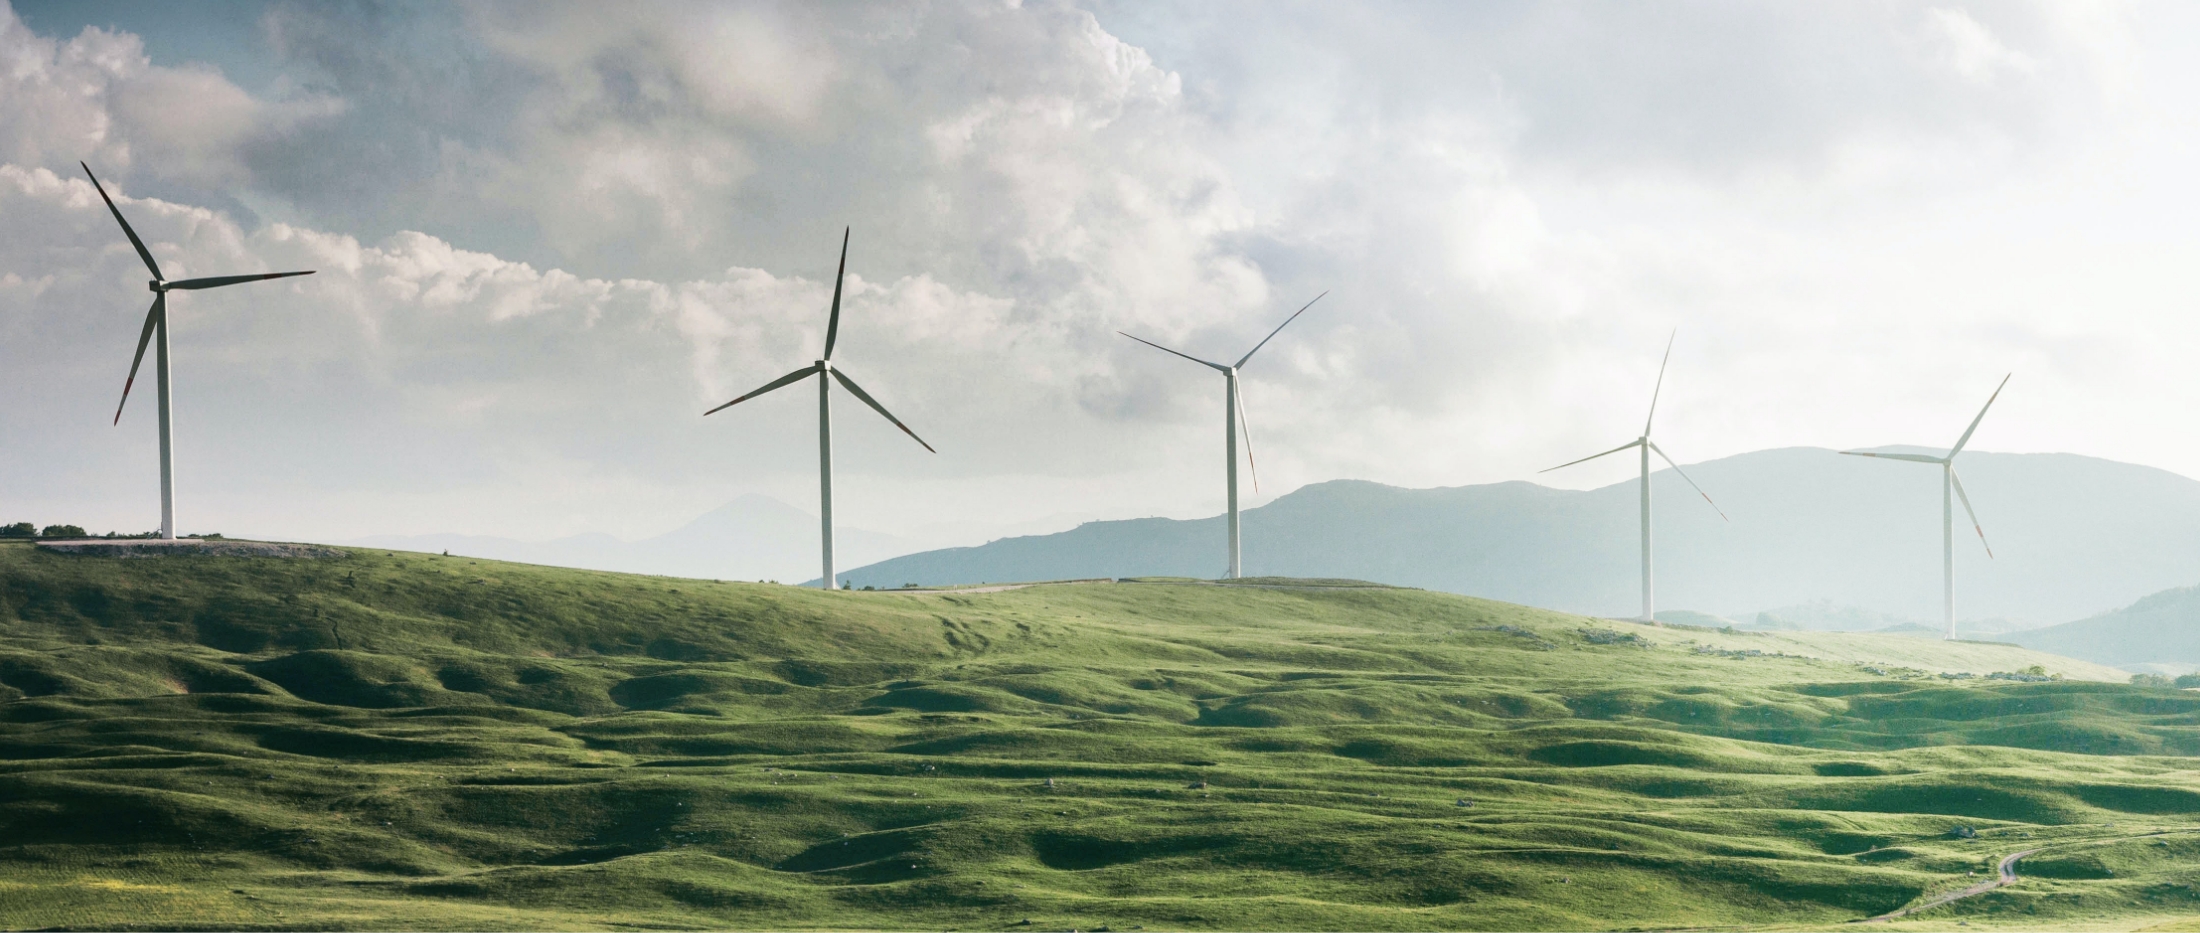
Solar energy is the cheapest and cleanest form of power generation. Solar potential insight helps municipalities and residents accelerate the energy transition. From awareness to policy: one data source for public map and professional analysis.
Generation
Roof potential mapped
Policy
RES & reporting
Residents
Public map
As a municipality or government you want to steer on solar energy and be accountable. Uncertain figures, reporting delays and resident resistance make that difficult.
You struggle with current figures on installed capacity and progress. Without reliable data, steering on realisation and RES targets stalls.
Resistance and lack of clear information delay projects. An accessible solar map helps residents and reduces unnecessary questions at the desk.
Council and administration want current figures; province and national government ask for substantiation. Without consistent data, reporting is difficult.
“To meet climate targets, about 5 GWp of new solar capacity is needed annually; in 2024 about 3.4 GWp was installed.”
One map: roof potential, installed capacity and progress per neighbourhood or district. For steering on realisation, RES reporting and policy choices.
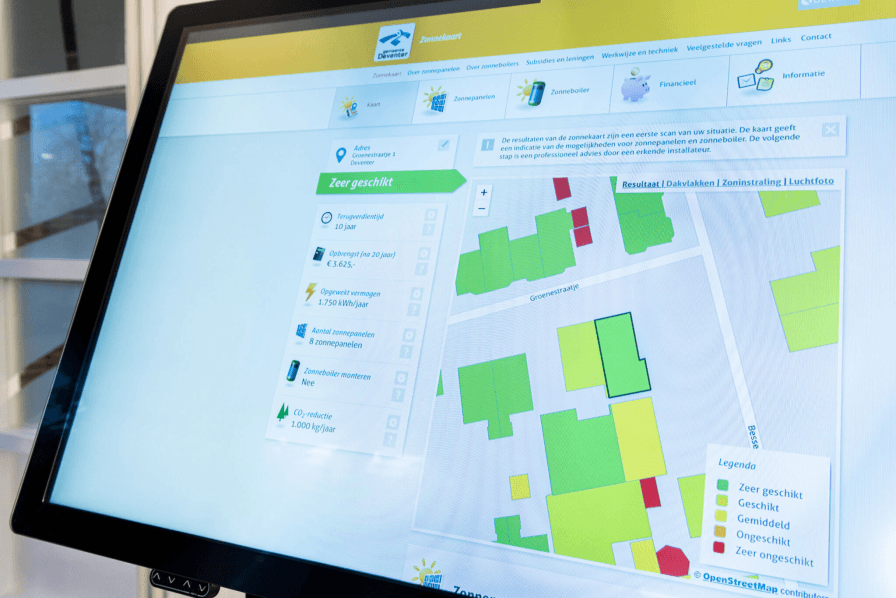
Use the same current data for public communication and professional analysis. Residents can see what their roof can deliver; policymakers steer on progress, potential and reporting.
View optionsSolar is available as Solar Map for residents and Solar Map Pro for policy and decision-making. Both have their place; they serve different purposes.
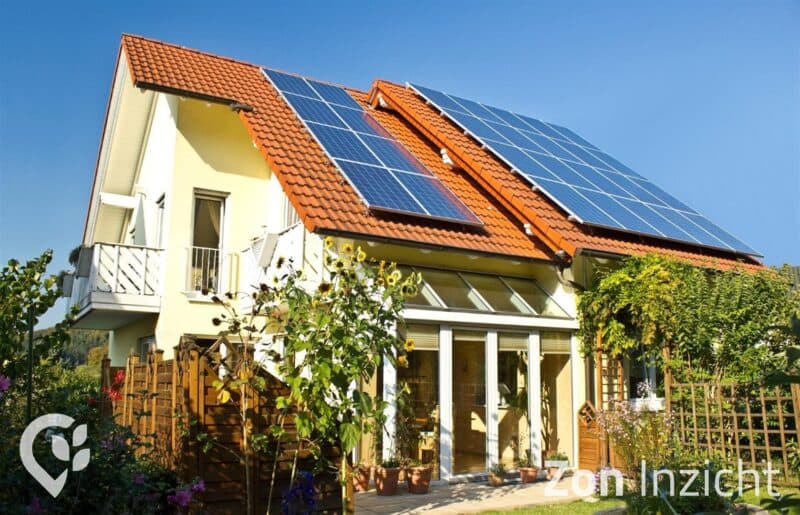
An accessible solar map so residents can see if their roof is suitable for solar panels and what the estimated yield is. Ideal to inform residents.
For policymakers and governments: solar panel detections, solar monitor, dashboards and reports. RES monitoring, export and connection to your own GIS or portal.
Solar is based on current data and a reliable solar monitor. That gives you insight into installed capacity, roof potential and progress.
We arrange detection of panels on roofs from current aerial imagery, combining manual review and AI.
The solar monitor maps installed capacity, roof potential and progress per area.
A comprehensive toolkit for municipalities taking solar seriously. From policy to practice: measurable results for a sustainable energy transition.
Detailed analysis of solar potential on all roofs in your municipality.
Accurate calculation of expected energy yield and financial returns.
Smart site selection for solar projects based on data.
Tools to communicate effectively with residents about solar energy.
Current page
Solar Insight is seamlessly integrated into the DZHK platform, together with all your other sustainability data for one complete energy transition picture.
Solar energy
Experiences from organisations working with DZHK.
“Berekeningen waarvoor we vroeger een week nodig hadden, zijn nu in enkele minuten klaar. Dat bespaart ons enorm veel tijd én geld.”

“We presenteren onze expertise niet meer als saaie rapporten, maar als interactieve kaartapplicaties. Zelfs mensen zonder technische kennis kunnen er gebruik van maken, wat Duurzaamheidskaart tot een essentiële basis maakt voor beleidsvorming.”

“Duurzaamheidskaart heeft ons geholpen om duurzaamheidsdata toegankelijk te maken voor iedereen. Het platform combineert krachtige visualisatie met eenvoudige gebruikerservaring.”
“Samen met MapGear (Duurzaamheidskaart) konden we een realistische prognose maken van de zonnepotentie in Groningen in 2035. We combineren data over daken, warmtepompen, elektrisch rijden en beleidskeuzes voor een betrouwbaar toekomstbeeld.”
“Samen met MapGear (Duurzaamheidskaart) ontwikkelden we de TransitiePlanner. Deze stelt ons in staat data te verzamelen, analyseren en visualiseren over energieverbruik, klimaatadaptatie en duurzame mobiliteit. We bouwen een dynamisch dossier op voor duurzame bedrijventerreinen.”

“De duurzaamheidskaart heeft ons geholpen om onze energietransitieprojecten efficiënter te plannen en uit te voeren.”

“Met Asbestdakenkaart hebben we voor het eerst overzicht op onze asbestdata en saneringsvoortgang. Eén plek om te prioriteren, monitoren en rapporteren.”
“Berekeningen waarvoor we vroeger een week nodig hadden, zijn nu in enkele minuten klaar. Dat bespaart ons enorm veel tijd én geld.”
“We presenteren onze expertise niet meer als saaie rapporten, maar als interactieve kaartapplicaties. Zelfs mensen zonder technische kennis kunnen er gebruik van maken, wat Duurzaamheidskaart tot een essentiële basis maakt voor beleidsvorming.”
“Duurzaamheidskaart heeft ons geholpen om duurzaamheidsdata toegankelijk te maken voor iedereen. Het platform combineert krachtige visualisatie met eenvoudige gebruikerservaring.”
“Samen met MapGear (Duurzaamheidskaart) konden we een realistische prognose maken van de zonnepotentie in Groningen in 2035. We combineren data over daken, warmtepompen, elektrisch rijden en beleidskeuzes voor een betrouwbaar toekomstbeeld.”
“Samen met MapGear (Duurzaamheidskaart) ontwikkelden we de TransitiePlanner. Deze stelt ons in staat data te verzamelen, analyseren en visualiseren over energieverbruik, klimaatadaptatie en duurzame mobiliteit. We bouwen een dynamisch dossier op voor duurzame bedrijventerreinen.”
“De duurzaamheidskaart heeft ons geholpen om onze energietransitieprojecten efficiënter te plannen en uit te voeren.”
“Met Asbestdakenkaart hebben we voor het eerst overzicht op onze asbestdata en saneringsvoortgang. Eén plek om te prioriteren, monitoren en rapporteren.”
Request a demo for solar monitoring, RES reporting and panel detections.
Answers about Solar, Solar Map and Solar Map Pro.
Trusted by municipalities, provinces and organisations in the Netherlands and Belgium


Want to know what we can do for your organisation? Contact us for a no-obligation demo. Special requirements? No problem — leave your details below.