

Choose your product(s)
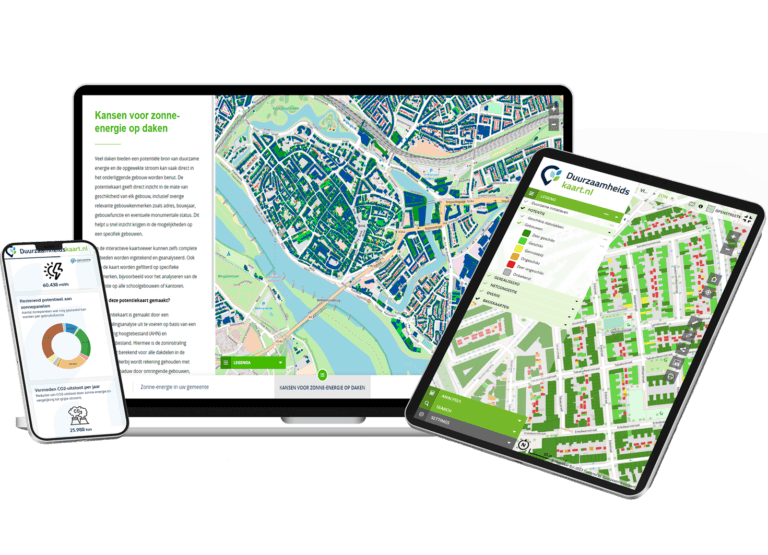
Each product includes valuable insights we refresh annually, in an easy-to-share map for analysis, and in a clear interactive report. Extras such as dashboards for trends are available too.
DZHK gives you current insight into sustainable opportunities in your municipality or province: solar, heat, heat stress and climate adaptation. We make your sustainability data visual and easy to grasp: one place, with effective tools for analysis and monitoring. User-friendly and interactive.
Trusted by municipalities, provinces and organisations in the Netherlands and Belgium


Your sustainability data stays current and easy to access.
Everything clearly organised in a single platform.
Advanced tools for deeper insight and monitoring.
An intuitive interface for every user.
Automated reports for efficient communication with stakeholders.
DZHK products align with current societal themes in the public realm. We currently offer valuable insights in the following areas:

Monitor heat, drought and flood risk for effective climate adaptation.
Solar map for residents and Solar Map Pro for policy: potential and monitoring.
Analyse sustainable heat sources and plan gas-free district heating.
Reduce heat stress with cool-spot planning and shade measures.
Develop green strategies using the 3–30–300 rule for liveable cities.
Assess green-roof potential and whether your roof is suitable.
Inventory asbestos roofs and coordinate sustainable renovation.
Map protected species for nature-friendly construction projects.
Analyse energy-saving potential of homes for effective insulation.
DICE (collective energy projects service): from grid congestion to collective action on business parks. More at dicedashboard.nl.
Using our solutions
Specialist data solutions
Cloud-based access
Current data and updates
Powerful tools and features for sustainability data visualization and monitoring
Visualize complex sustainability data on understandable maps. Zoom in, filter and analyze data at different scale levels.
Monitor progress and performance with real-time dashboards. Generate automatic reports for stakeholders and management.
Engage residents in sustainability projects with public tools and participation platforms. Make data accessible and discussable.
Your data is secure with enterprise-grade security. Regular backups and updates ensure reliable availability.
Start with Duurzaamheidskaart within a few weeks. Our team ensures quick configuration and seamless integration.
Grows with your organization. Add new products and features when you need them.
From product choice to go-live in three steps.
Each product includes valuable insights we refresh annually, in an easy-to-share map for analysis, and in a clear interactive report. Extras such as dashboards for trends are available too.
Tell us which products or services interest you. Use the contact form to request a no-obligation demo or a tailored quote, we will get back to you as soon as we can.
You receive access to a secure online environment with all your products in one place. We guide your onboarding so you can get started effectively, and support is there when you need it.
Experiences from organisations working with DZHK.
“Berekeningen waarvoor we vroeger een week nodig hadden, zijn nu in enkele minuten klaar. Dat bespaart ons enorm veel tijd én geld.”

“We presenteren onze expertise niet meer als saaie rapporten, maar als interactieve kaartapplicaties. Zelfs mensen zonder technische kennis kunnen er gebruik van maken, wat Duurzaamheidskaart tot een essentiële basis maakt voor beleidsvorming.”
“Duurzaamheidskaart heeft ons geholpen om duurzaamheidsdata toegankelijk te maken voor iedereen. Het platform combineert krachtige visualisatie met eenvoudige gebruikerservaring.”
“Samen met MapGear (Duurzaamheidskaart) konden we een realistische prognose maken van de zonnepotentie in Groningen in 2035. We combineren data over daken, warmtepompen, elektrisch rijden en beleidskeuzes voor een betrouwbaar toekomstbeeld.”
“Samen met MapGear (Duurzaamheidskaart) ontwikkelden we de TransitiePlanner. Deze stelt ons in staat data te verzamelen, analyseren en visualiseren over energieverbruik, klimaatadaptatie en duurzame mobiliteit. We bouwen een dynamisch dossier op voor duurzame bedrijventerreinen.”

“De duurzaamheidskaart heeft ons geholpen om onze energietransitieprojecten efficiënter te plannen en uit te voeren.”
“Met Asbestdakenkaart hebben we voor het eerst overzicht op onze asbestdata en saneringsvoortgang. Eén plek om te prioriteren, monitoren en rapporteren.”
“Berekeningen waarvoor we vroeger een week nodig hadden, zijn nu in enkele minuten klaar. Dat bespaart ons enorm veel tijd én geld.”
“We presenteren onze expertise niet meer als saaie rapporten, maar als interactieve kaartapplicaties. Zelfs mensen zonder technische kennis kunnen er gebruik van maken, wat Duurzaamheidskaart tot een essentiële basis maakt voor beleidsvorming.”
“Duurzaamheidskaart heeft ons geholpen om duurzaamheidsdata toegankelijk te maken voor iedereen. Het platform combineert krachtige visualisatie met eenvoudige gebruikerservaring.”
“Samen met MapGear (Duurzaamheidskaart) konden we een realistische prognose maken van de zonnepotentie in Groningen in 2035. We combineren data over daken, warmtepompen, elektrisch rijden en beleidskeuzes voor een betrouwbaar toekomstbeeld.”
“Samen met MapGear (Duurzaamheidskaart) ontwikkelden we de TransitiePlanner. Deze stelt ons in staat data te verzamelen, analyseren en visualiseren over energieverbruik, klimaatadaptatie en duurzame mobiliteit. We bouwen een dynamisch dossier op voor duurzame bedrijventerreinen.”
“De duurzaamheidskaart heeft ons geholpen om onze energietransitieprojecten efficiënter te plannen en uit te voeren.”
“Met Asbestdakenkaart hebben we voor het eerst overzicht op onze asbestdata en saneringsvoortgang. Eén plek om te prioriteren, monitoren en rapporteren.”
Find quick answers to the most common questions about Duurzaamheidskaart
You request a demo or conversation; we’ll discuss with you whether there’s a good fit. Depending on your situation, we can show examples from other municipalities or provinces, or arrange temporary access to data from a neighbouring authority that already uses Duurzaamheidskaart. It depends on your timeline and data availability; we’re happy to work through the options with you.
Duurzaamheidskaart integrates data from various sources such as aerial photos, BAG data, climate models and energy data. You can also upload your own data for integrated analyses. We can also perform solar panel detections or other analyses for you, or create, analyze or report on data, with our GIS team and experts from our partner network.
Yes. Training focuses on using the platform as a viewer: your team learns to use the low-touch analysis tools without needing to be an expert in data or GIS. Because we build on a GIS platform, we can also support GIS-related use. We also run workshops with the Duurzaamheidstafel for participation and presentation.
Yes. You can upload your own GIS data, spreadsheets and other sources, or connect via web services (e.g. WMS, WFS or API). We’re happy to advise which approach is most effective for your situation (one-off upload, periodic sync or live connection via web services) so you get the most efficient setup. Our team helps configure and secure the integration.
We often create setups for annual or bi-annual data and analyses. You then get access to the viewer with maps per theme and analysis tools. Pricing depends on the number of users, what you want to share, and which themes and updates you need. Contact us for a tailored quote.
Want to know what we can do for your organisation? Contact us for a no-obligation demo. Special requirements? No problem — leave your details below.