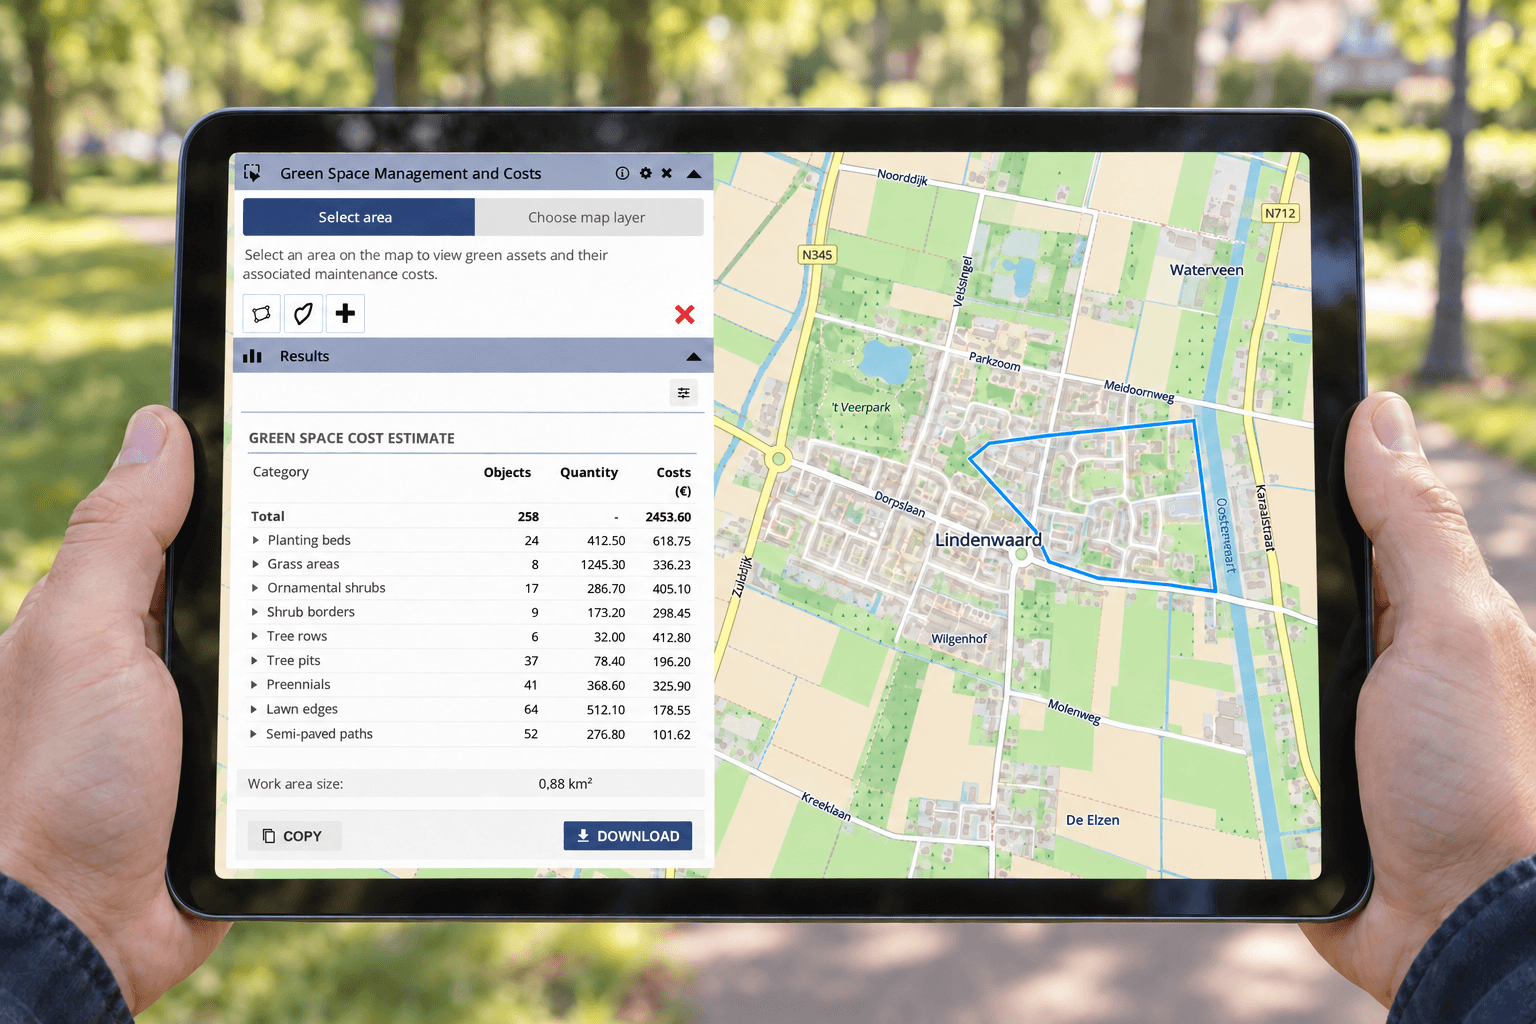
For many people, a solar map is their first introduction to sustainability data. It answers a practical question: could the roof of their home be suitable for solar panels? Accessible maps like these help residents explore opportunities and understand information relevant to their property.
Municipalities, housing associations and businesses need to answer broader questions. They must compare neighbourhoods, assess portfolios and explain investment priorities. This requires a view that connects individual locations with wider sustainability objectives.
Match the information to the decision
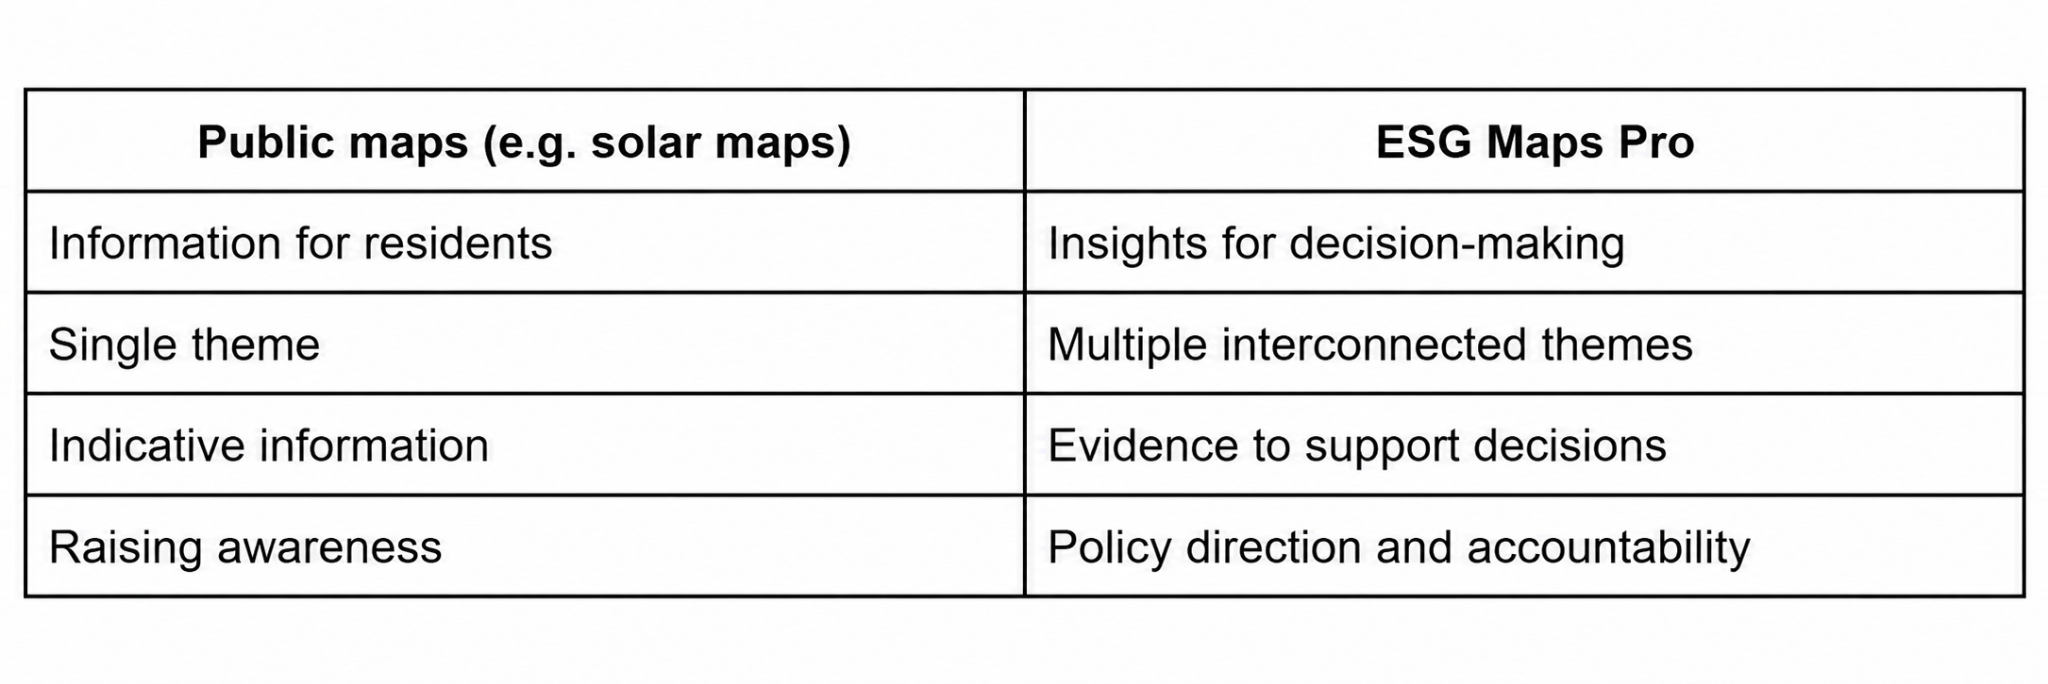
Different audiences need different information. A resident may want an understandable indication of rooftop solar potential, while a housing association needs to compare opportunities across multiple properties and planned renovation projects.
Similarly, a municipality needs to understand how conditions vary between areas. Decision-makers must be able to explain why one neighbourhood receives attention before another and which information supports that choice.
Public maps and professional analysis therefore serve complementary purposes. An accessible public view supports communication, while a professional environment provides the context needed for planning, comparison and reporting.
Connect sustainability themes through location
Adding more datasets does not automatically make a decision clearer. Separate indicators can describe individual issues without showing how they interact in the same place.
For example, a neighbourhood improvement programme may involve energy measures, greener outdoor spaces and changes to mobility. Examining these themes together helps teams investigate where opportunities overlap and where proposed measures require closer coordination.
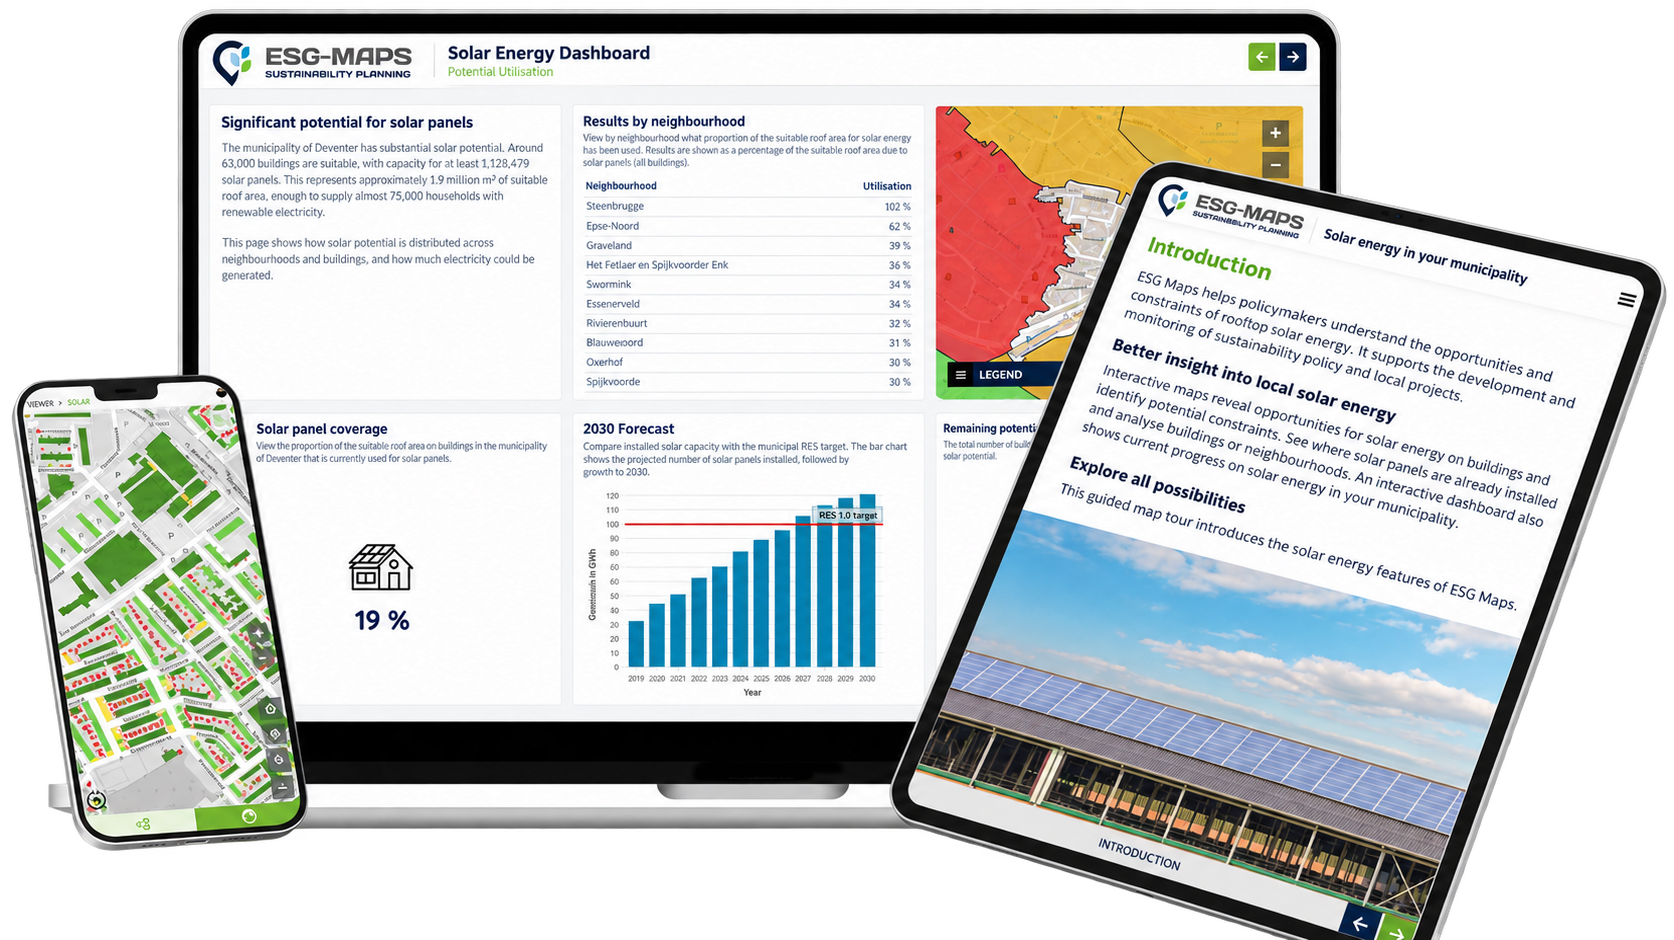
ESG-Maps brings sustainability information into a shared spatial environment. By connecting data to buildings, neighbourhoods and project areas, teams can examine patterns and differences in context. Depending on the question, relevant themes may include solar potential, heat sources, urban greenery and heat exposure.
Turn analysis into priorities that can be explained
Once information is connected geographically, teams can move from exploring conditions to discussing priorities. The discussion becomes more specific: which area needs further investigation, what supports that assessment and which other factors must be considered?
This provides a basis for policy development, investment discussions and reporting. However, the reasoning still needs to be clear. Teams should explain the datasets, assumptions and selection criteria behind an assessment, alongside any information that requires further verification.
The same spatial context can also support communication with residents, partners and oversight bodies. A map helps show where a proposed intervention applies, while the accompanying explanation makes the reasoning behind it accessible.
Put your sustainability data to work
Explore how ESG-Maps can support area analysis, investment priorities and policy discussions within your organisation.
Contact us to discuss your sustainability questions and the information needed to address them.