Urban greenery contributes to healthier, more liveable and climate-resilient neighbourhoods. However, municipalities often struggle to determine which neighbourhoods have enough greenery, where green spaces are difficult to access and where additional measures could have the greatest impact.
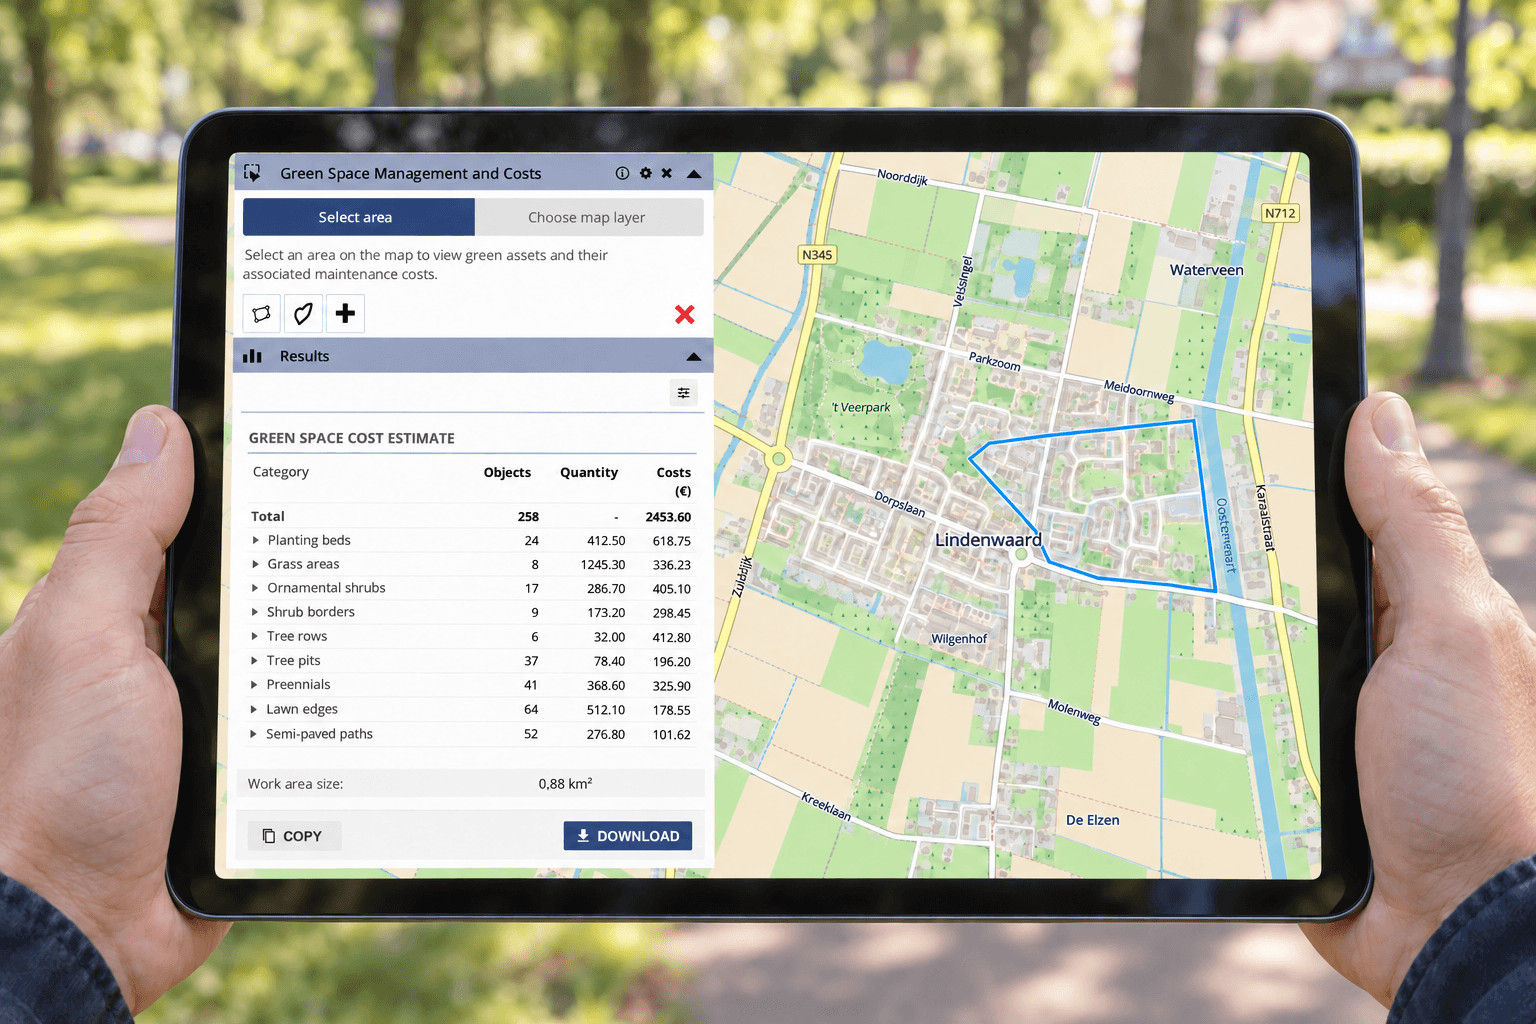
Green Insights makes these spatial differences visible in an interactive map. Municipalities can examine green infrastructure, compare neighbourhoods and target measures more effectively based on biodiversity, accessibility and climate adaptation.
Visualising the 3-30-300 rule
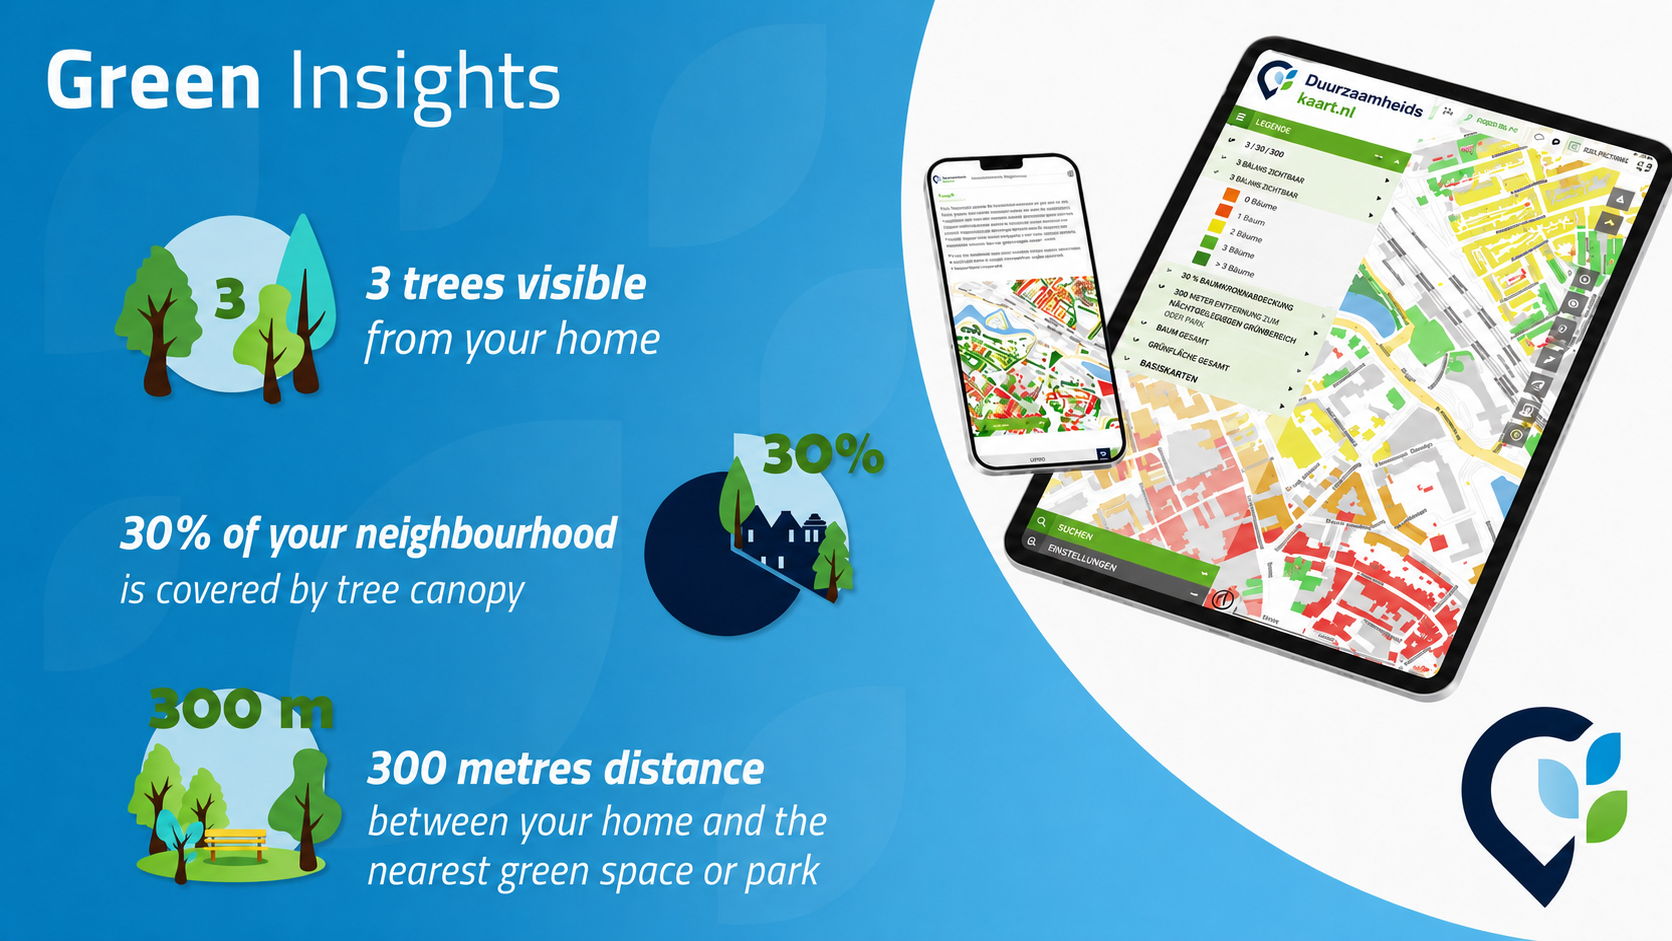
The 3-30-300 rule provides a clear framework for assessing urban greenery. It considers whether residents can see three trees from their homes, whether a neighbourhood has at least 30% tree canopy cover and whether everyone lives within 300 metres of a substantial green space.
In practice, these goals cannot be evaluated using municipality-wide figures alone. An area may appear green overall while individual streets have few trees or residents have limited access to public green spaces. Spatial analysis at neighbourhood, street or building level is therefore essential.
Green Insights translates each part of the rule into map-based information. This reveals which areas are already well served and where additional trees, green spaces or stronger connections between existing green areas may be needed.
From green space to biodiversity and accessibility
The amount of greenery is only one part of an effective municipal strategy. Its quality, distribution and ecological connectivity are equally important. A large green area on the edge of a city, for example, does not necessarily provide the same benefits as a well-distributed network of parks, street trees, gardens and green corridors.
Green Insights combines different spatial datasets in one map environment. Green spaces, tree cover, buildings, neighbourhoods and relevant environmental information can be viewed together. This gives municipalities a clearer picture of where greenery is available, how accessible it is and where opportunities exist to improve ecological connectivity.
This approach also supports biodiversity. By viewing green spaces as part of a connected network instead of as isolated areas, municipalities can plan measures more effectively and strengthen connections between existing habitats.
Prioritising measures more effectively
Municipalities usually have limited space, budgets and staff capacity. It is therefore important to invest where the need and potential impact are greatest instead of applying the same measures everywhere.
Spatial analysis can reveal which neighbourhoods have limited shade, where larger green spaces are difficult to reach and where paved surfaces offer opportunities for additional greenery. These insights help municipalities prioritise measures such as tree planting, green façades, new green spaces and improved green corridors.
The maps also provide a shared foundation for collaboration between departments responsible for green-space management, urban planning, climate adaptation, public health and social development. Instead of working with separate spreadsheets and reports, teams gain a common spatial overview.
How Green Insights supports municipal greening strategies
Green Insights presents complex environmental and green-space data in an accessible map environment. Users can move from a municipality-wide overview to individual neighbourhoods or streets, combine relevant map layers and identify spatial differences more easily.
This creates a shared source of information for analysis, policymaking and implementation. Municipalities can monitor progress, explain decisions more transparently and communicate results clearly to internal teams, policymakers and residents.
An effective greening strategy begins with a clear understanding of the current situation. Which areas already meet the desired targets? Which neighbourhoods require additional attention? Which measures could simultaneously improve biodiversity, heat resilience, accessibility and the quality of public spaces?
Would you like to understand how greenery, biodiversity and accessibility are distributed across your municipality? Green Insights helps you identify spatial differences and prioritise measures more effectively.