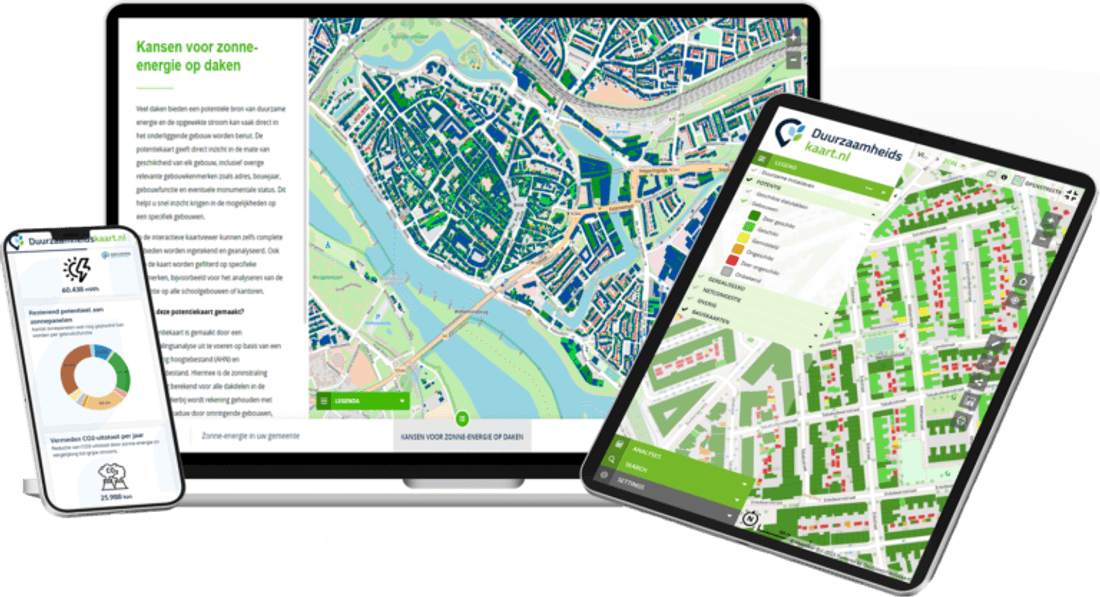
MapGear ontwikkelt Duurzaamheidskaart voor gemeente Leiden
‘Is mijn woning eigenlijk geschikt voor zonnepanelen?’ Het antwoord op die vraag zien inwoners van de gemeente Leiden binnenkort in de online Duurzaamheidskaart. MapGear gaat...
From scattered data to one overview
Municipalities sit on more and more sustainability data: heat maps, solar potential, uptake figures and spatial analysis. While that information stays spread across systems, it is hard to see how it fits together.
As part of the Year of the Roof 2020 programme, Leiden wanted to help residents make sustainable choices and give policymakers reliable area information. The municipality chose ESG Maps: one map environment where those layers meet.
Sustainable choices start with reliable information
Many residents start with a simple question: is my home suitable for solar panels? The answer depends on roof size, location, pitch, orientation and shade from neighbouring buildings. The map’s calculation model takes those factors into account.
Egbert Griffioen, founder of MapGear: “Thanks to the built-in calculation model, residents will be able to calculate the costs and yield of a solar installation of their choice, and how quickly it pays back.”
Ease of use decides whether people actually open the map
Information only helps if residents can find it. Homeowners can open the map from a PC, laptop or tablet when it suits them — in the evening on the sofa or on Saturday morning with the paper. Simple navigation and clear advice matter.
Historic inner cities need extra rules
Not every roof is suitable for panels. Leiden has listed buildings and protected townscapes. Appearance maps from the municipality are built into ESG Maps, so it is clear per area where panels are allowed — and where they must stay out of sight from the street.
More than solar
The same platform also shows opportunities for green roofs and other measures. Policymakers get one picture of sustainable development in the municipality.
Insight that grows with the city
Datasets can be extended and kept current. That makes the map a lasting source for area development, policy and investment decisions.
Leiden shows that successful sustainability work starts with overview: solar, green roofs and spatial data in one interactive map for residents and staff.
👉 Get in touch for a demo
Contact
Meer weten?
Heeft u vragen over onze producten? Wilt u een demo of offerte aanvragen? Vul het formulier in, dan nemen wij contact met u op.
Vul het formulier in en we nemen binnen 24 uur contact op, of boek .