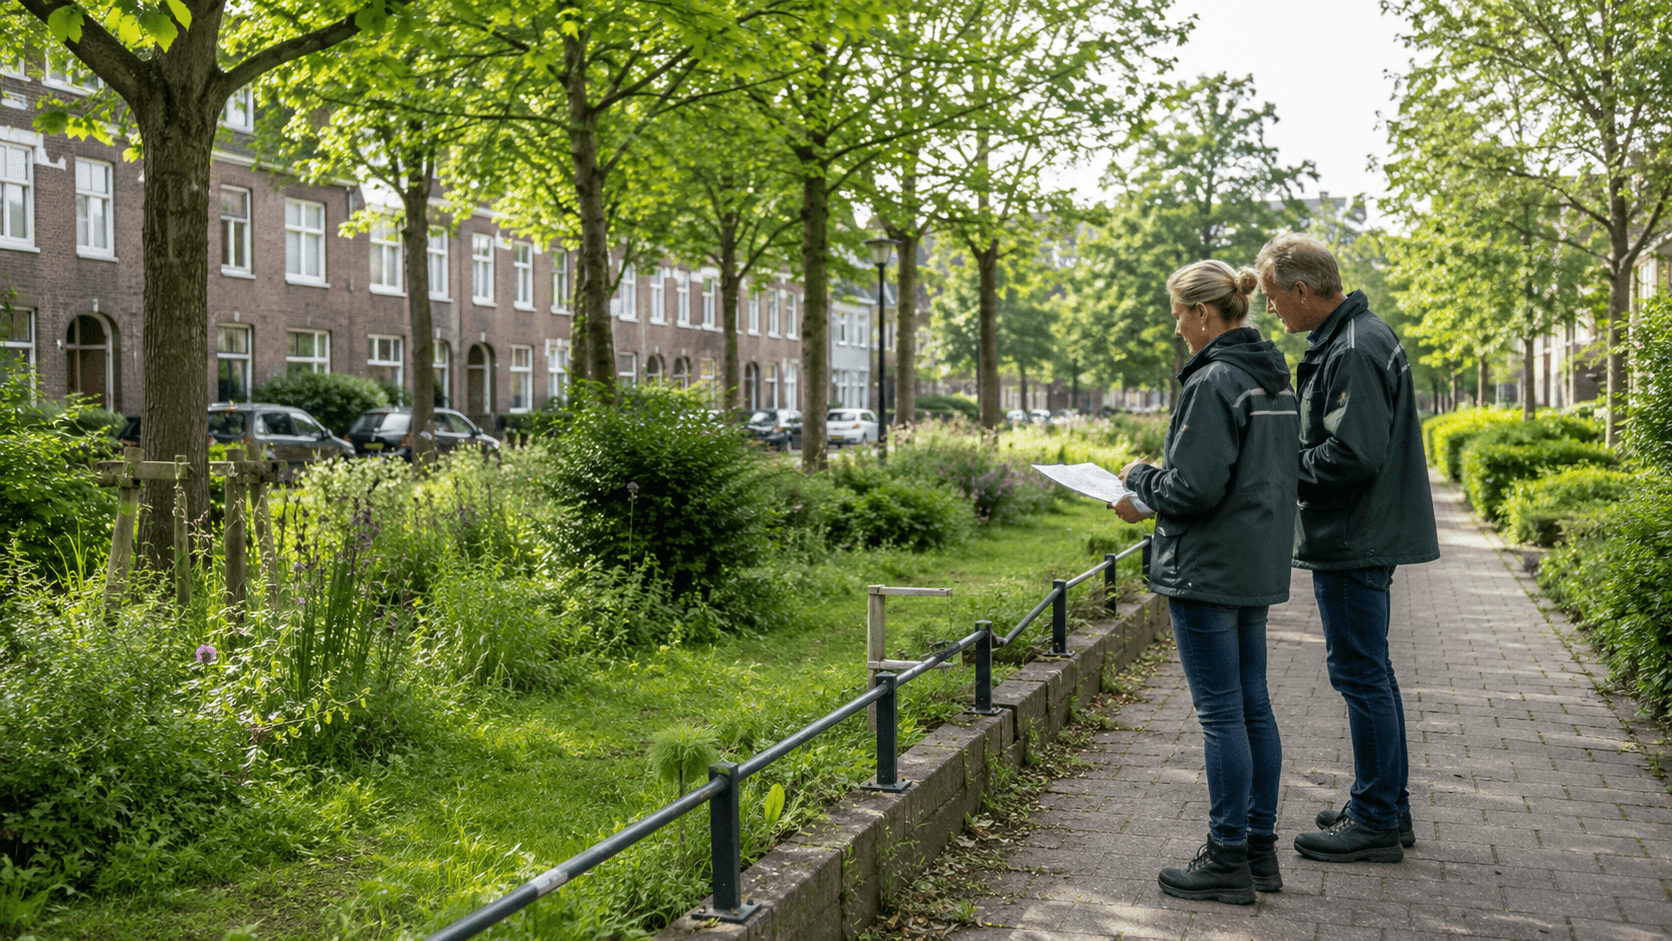
Some neighbourhoods benefit from mature trees, green spaces, water and plenty of shade. Others remain surrounded by paving, buildings and heat-retaining surfaces that stay warm long after the sun has gone down.
As summers become warmer, those differences increasingly affect health, comfort and the quality of the public realm. For municipalities, the challenge is not simply recognising that heat stress exists. The more important question is where intervention is needed most.
That is where geospatial data becomes valuable. By combining heat, green-space and climate information, municipalities can move beyond assumptions and identify the areas where cooling measures are likely to have the greatest impact. The original article similarly focuses on identifying neighbourhood-level heat problems before deciding where to invest.
Heat stress is not equally visible everywhere
Two neighbourhoods can appear similar in a policy report while experiencing very different conditions on the ground. A highly paved area with limited tree cover and little shade can heat up much faster than a greener neighbourhood only a short distance away.
For residents, that can mean higher perceived temperatures, fewer comfortable outdoor spaces and greater health risks during prolonged warm periods. These differences are not always obvious from complaints, general statistics or policy documents alone.
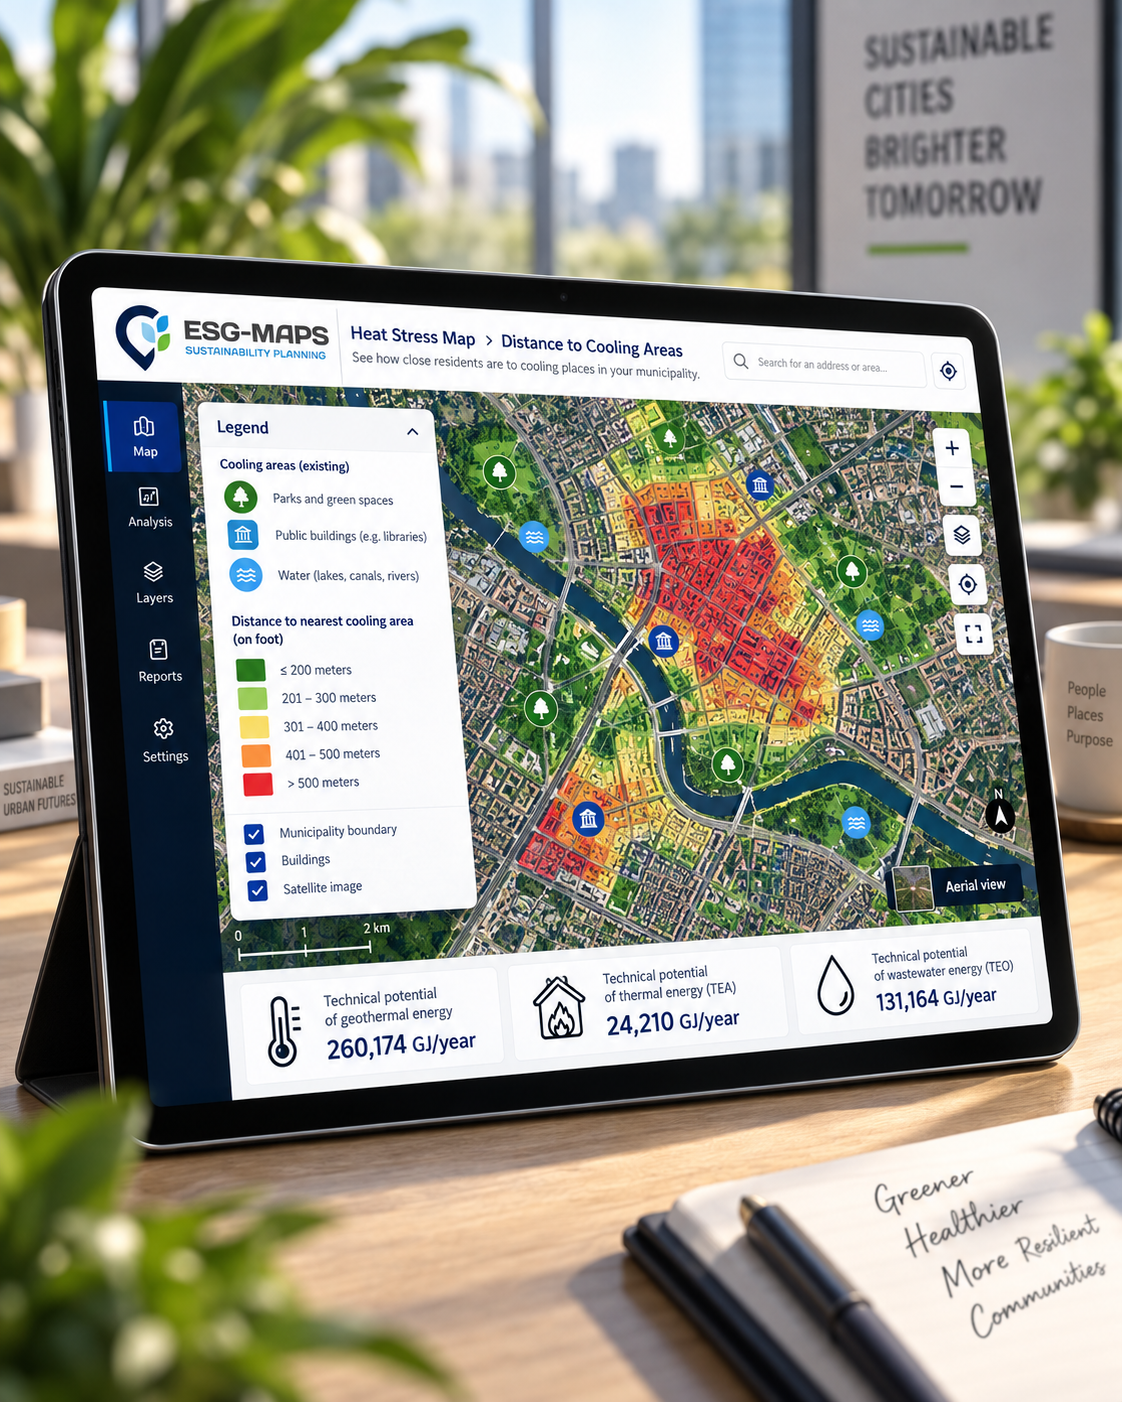
A heat-stress map adds the spatial context needed to understand where conditions differ. Municipalities can use it to identify areas that experience stronger heat effects, neighbourhoods where cooling facilities are limited, vulnerable locations and places where additional green space could make the greatest difference.
From local signals to evidence-based decisions
Residents often know which streets, squares and walking routes become uncomfortable during hot weather. That local knowledge is valuable because it reflects how people experience their neighbourhood in daily life.
However, effective climate-adaptation policy also requires an objective view of the wider area. Combining local experience with geospatial analysis helps municipalities understand whether individual signals are part of a broader pattern and where measures should be prioritised.
This can help answer practical questions such as where additional trees could provide the greatest benefit, which streets lack sufficient shade, where residents are furthest from cool places and which neighbourhoods should receive attention first.
Instead of applying the same measures everywhere, municipalities can use location-specific evidence to direct budgets towards the places where intervention is most relevant.
Better greening starts with better insight
Adding more green space sounds straightforward, but every municipality has limited space, budgets and implementation capacity. Choosing where to act therefore matters just as much as deciding what action to take.
Which neighbourhoods are most vulnerable? Where is cooling currently missing? Which streets would benefit most from shade? How can progress be monitored after measures have been implemented?
Without spatial insight, those decisions can remain largely assumption-based. With consistent geodata, municipalities can compare areas, justify priorities and explain more clearly why certain neighbourhoods receive measures first.
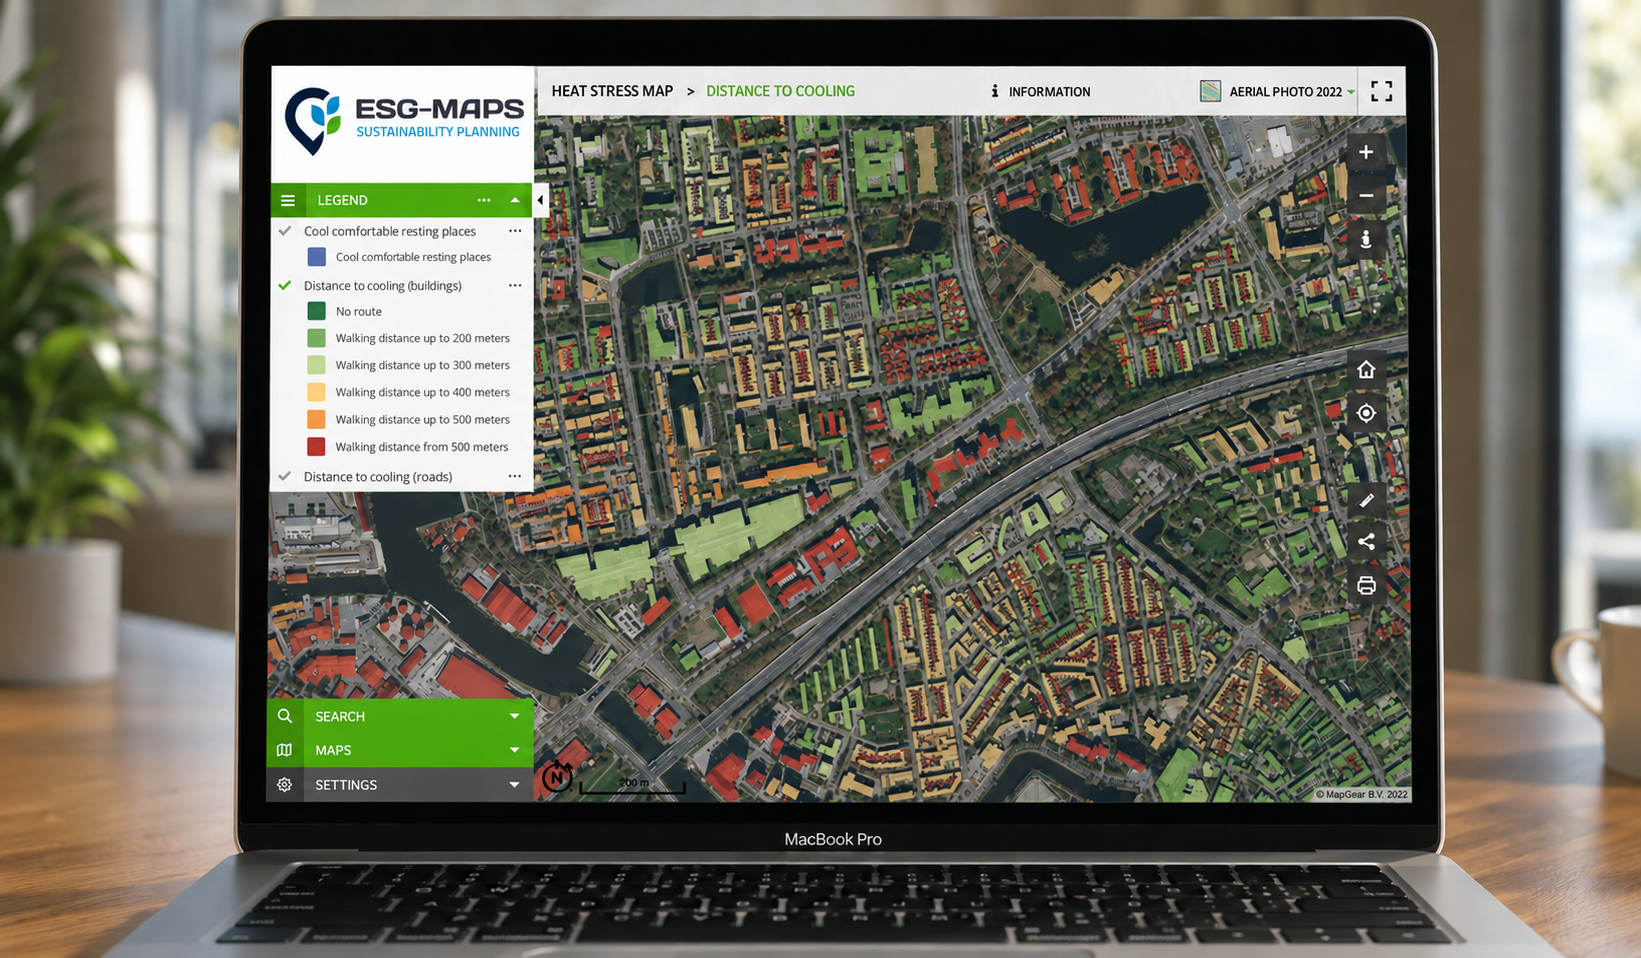
The current ESG-Maps Heat Stress Insight proposition follows this approach by combining indicators around heat, cool places, shade and green space so policy teams can analyse where interventions are most useful.
From heat map to concrete action
A heat-stress analysis becomes valuable when it supports an actual decision. The goal is not simply to create another map, but to give policymakers and implementation teams a practical way to move from identifying a problem to prioritising a response.
ESG-Maps brings sustainability and climate information together in an interactive environment where municipalities can analyse spatial patterns, compare areas and support monitoring and reporting. Heat Stress Insight can sit alongside other sustainability themes such as climate adaptation, green space, solar energy and environmental information, giving teams a broader understanding of how different challenges overlap geographically.
For heat-stress policy, this can make it easier to identify where heat problems are concentrated, which neighbourhoods require additional attention, where greening or shade could have the greatest effect and how conditions develop over time.
Cooling the neighbourhood starts with knowing where to act
Residents deserve neighbourhoods that remain healthy and liveable during increasingly warm periods. Achieving that requires more than a general ambition to create additional green space.
Municipalities need to understand where heat is most concentrated, where cooling is missing and where an intervention can create the greatest benefit. When those questions are supported by geospatial data, climate adaptation becomes easier to prioritise, explain and implement.
The result is not simply a better heat map. It is a stronger foundation for creating cooler, healthier and more climate-resilient neighbourhoods.
Where should your municipality prioritise cooling?