Duurzaamheidskaart
Insight into energy transition & climate adaptation with maps, dashboards and reporting
The irreversible consequences of climate change and the necessary energy transition are clearer than ever. In the Netherlands we are confronted daily with rising energy costs, waterlogging, drought and other effects of climate change.
Insight into energy transition & climate adaptation with maps, dashboards and reporting
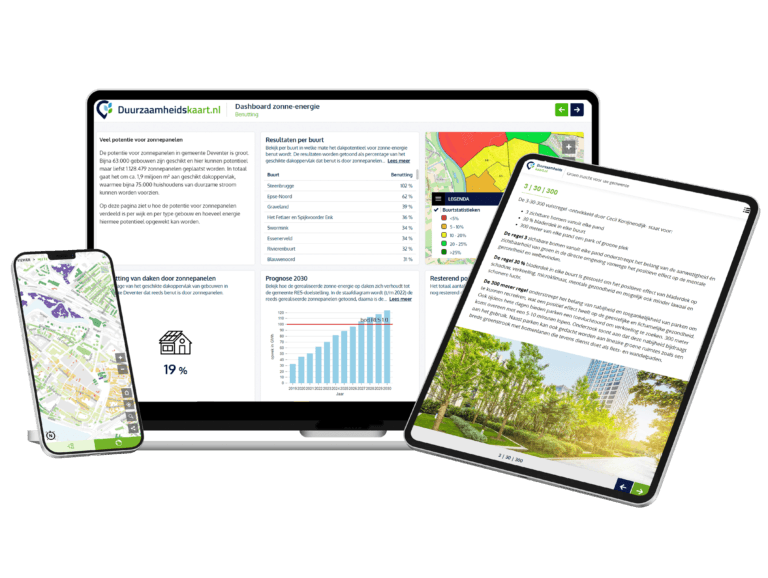
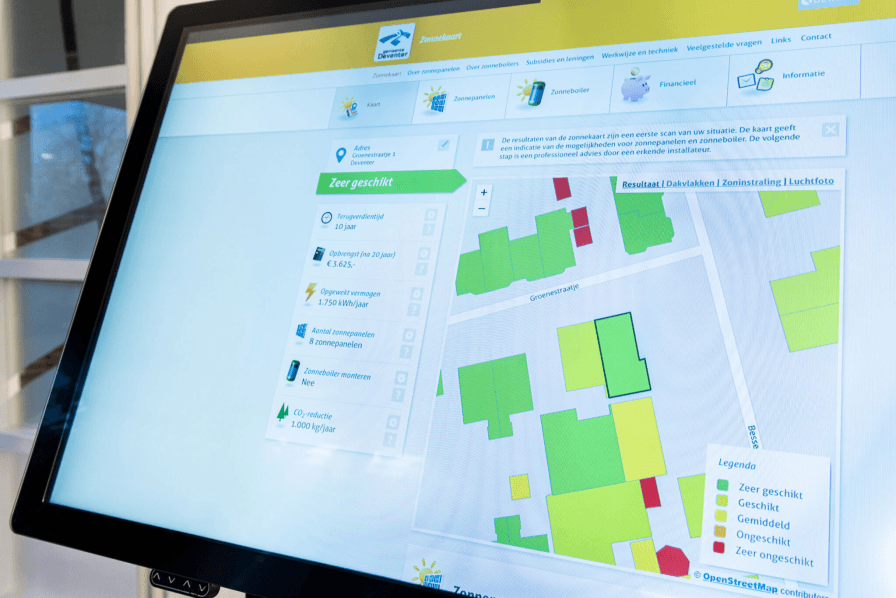
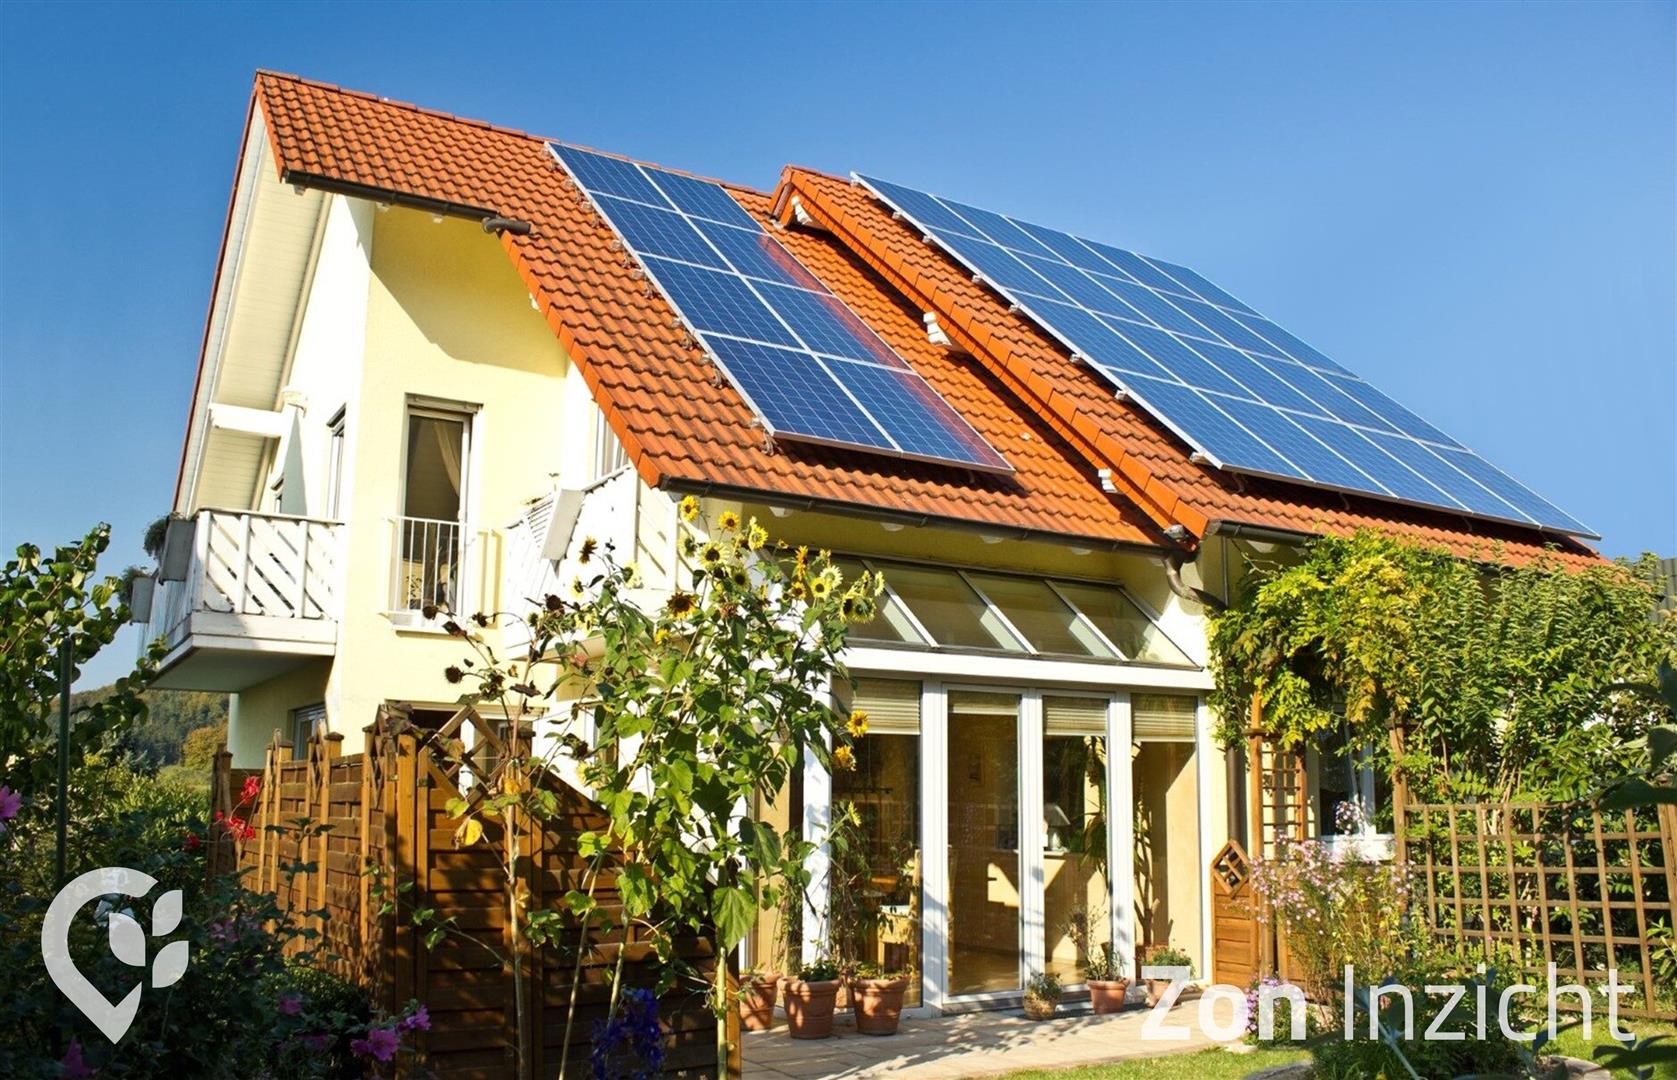
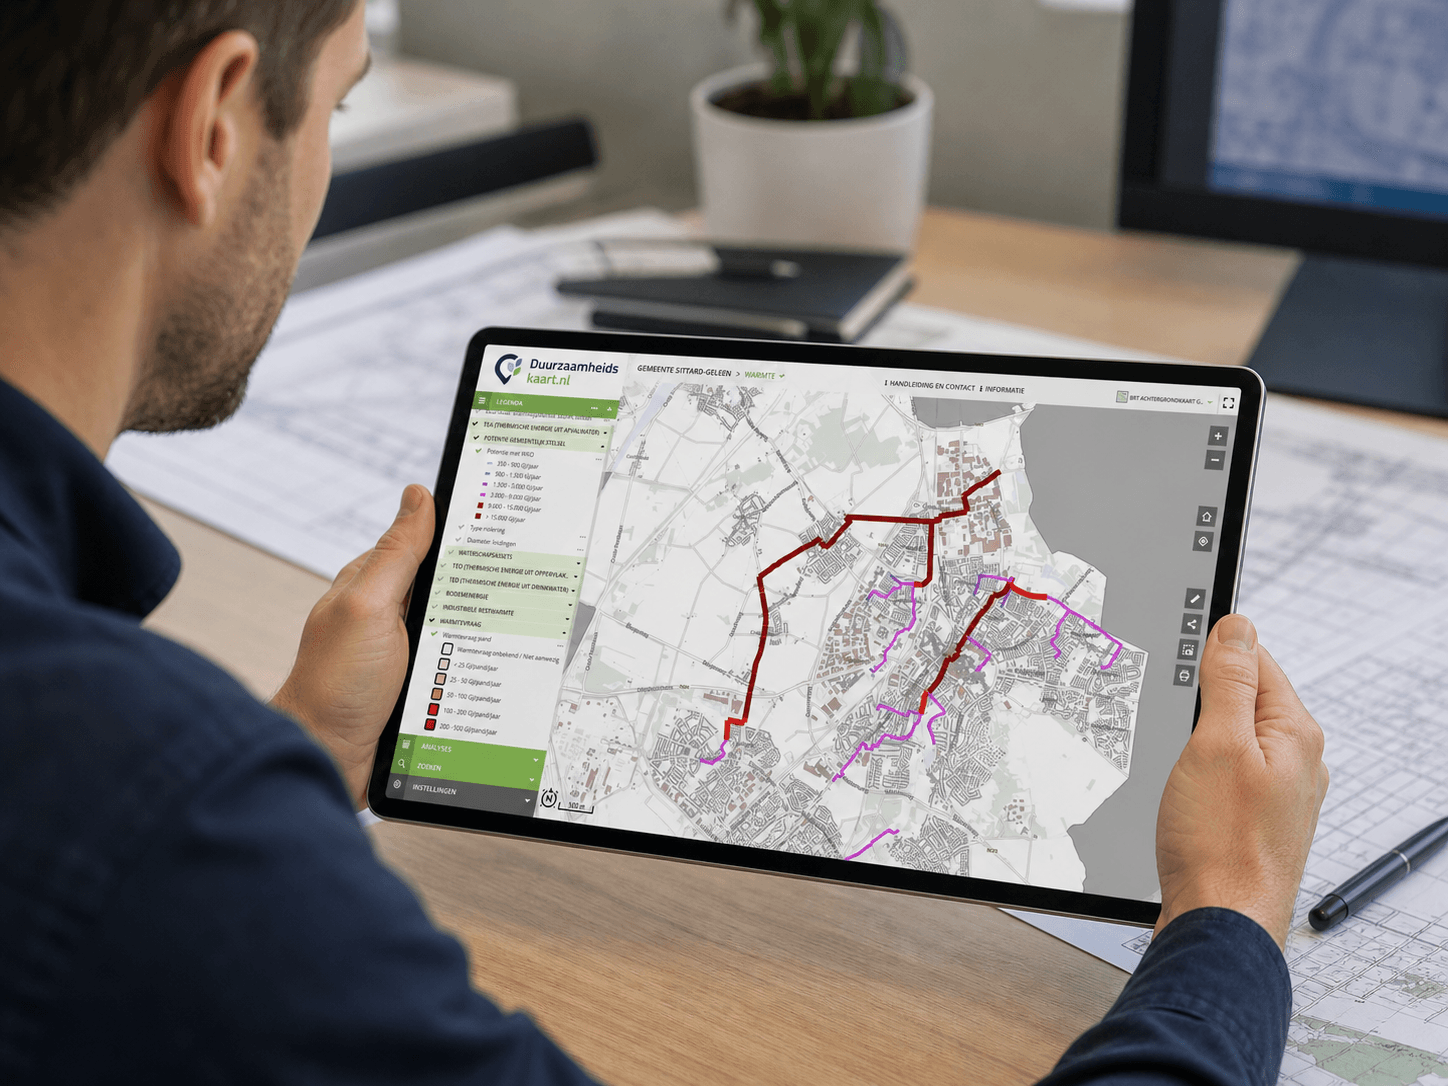
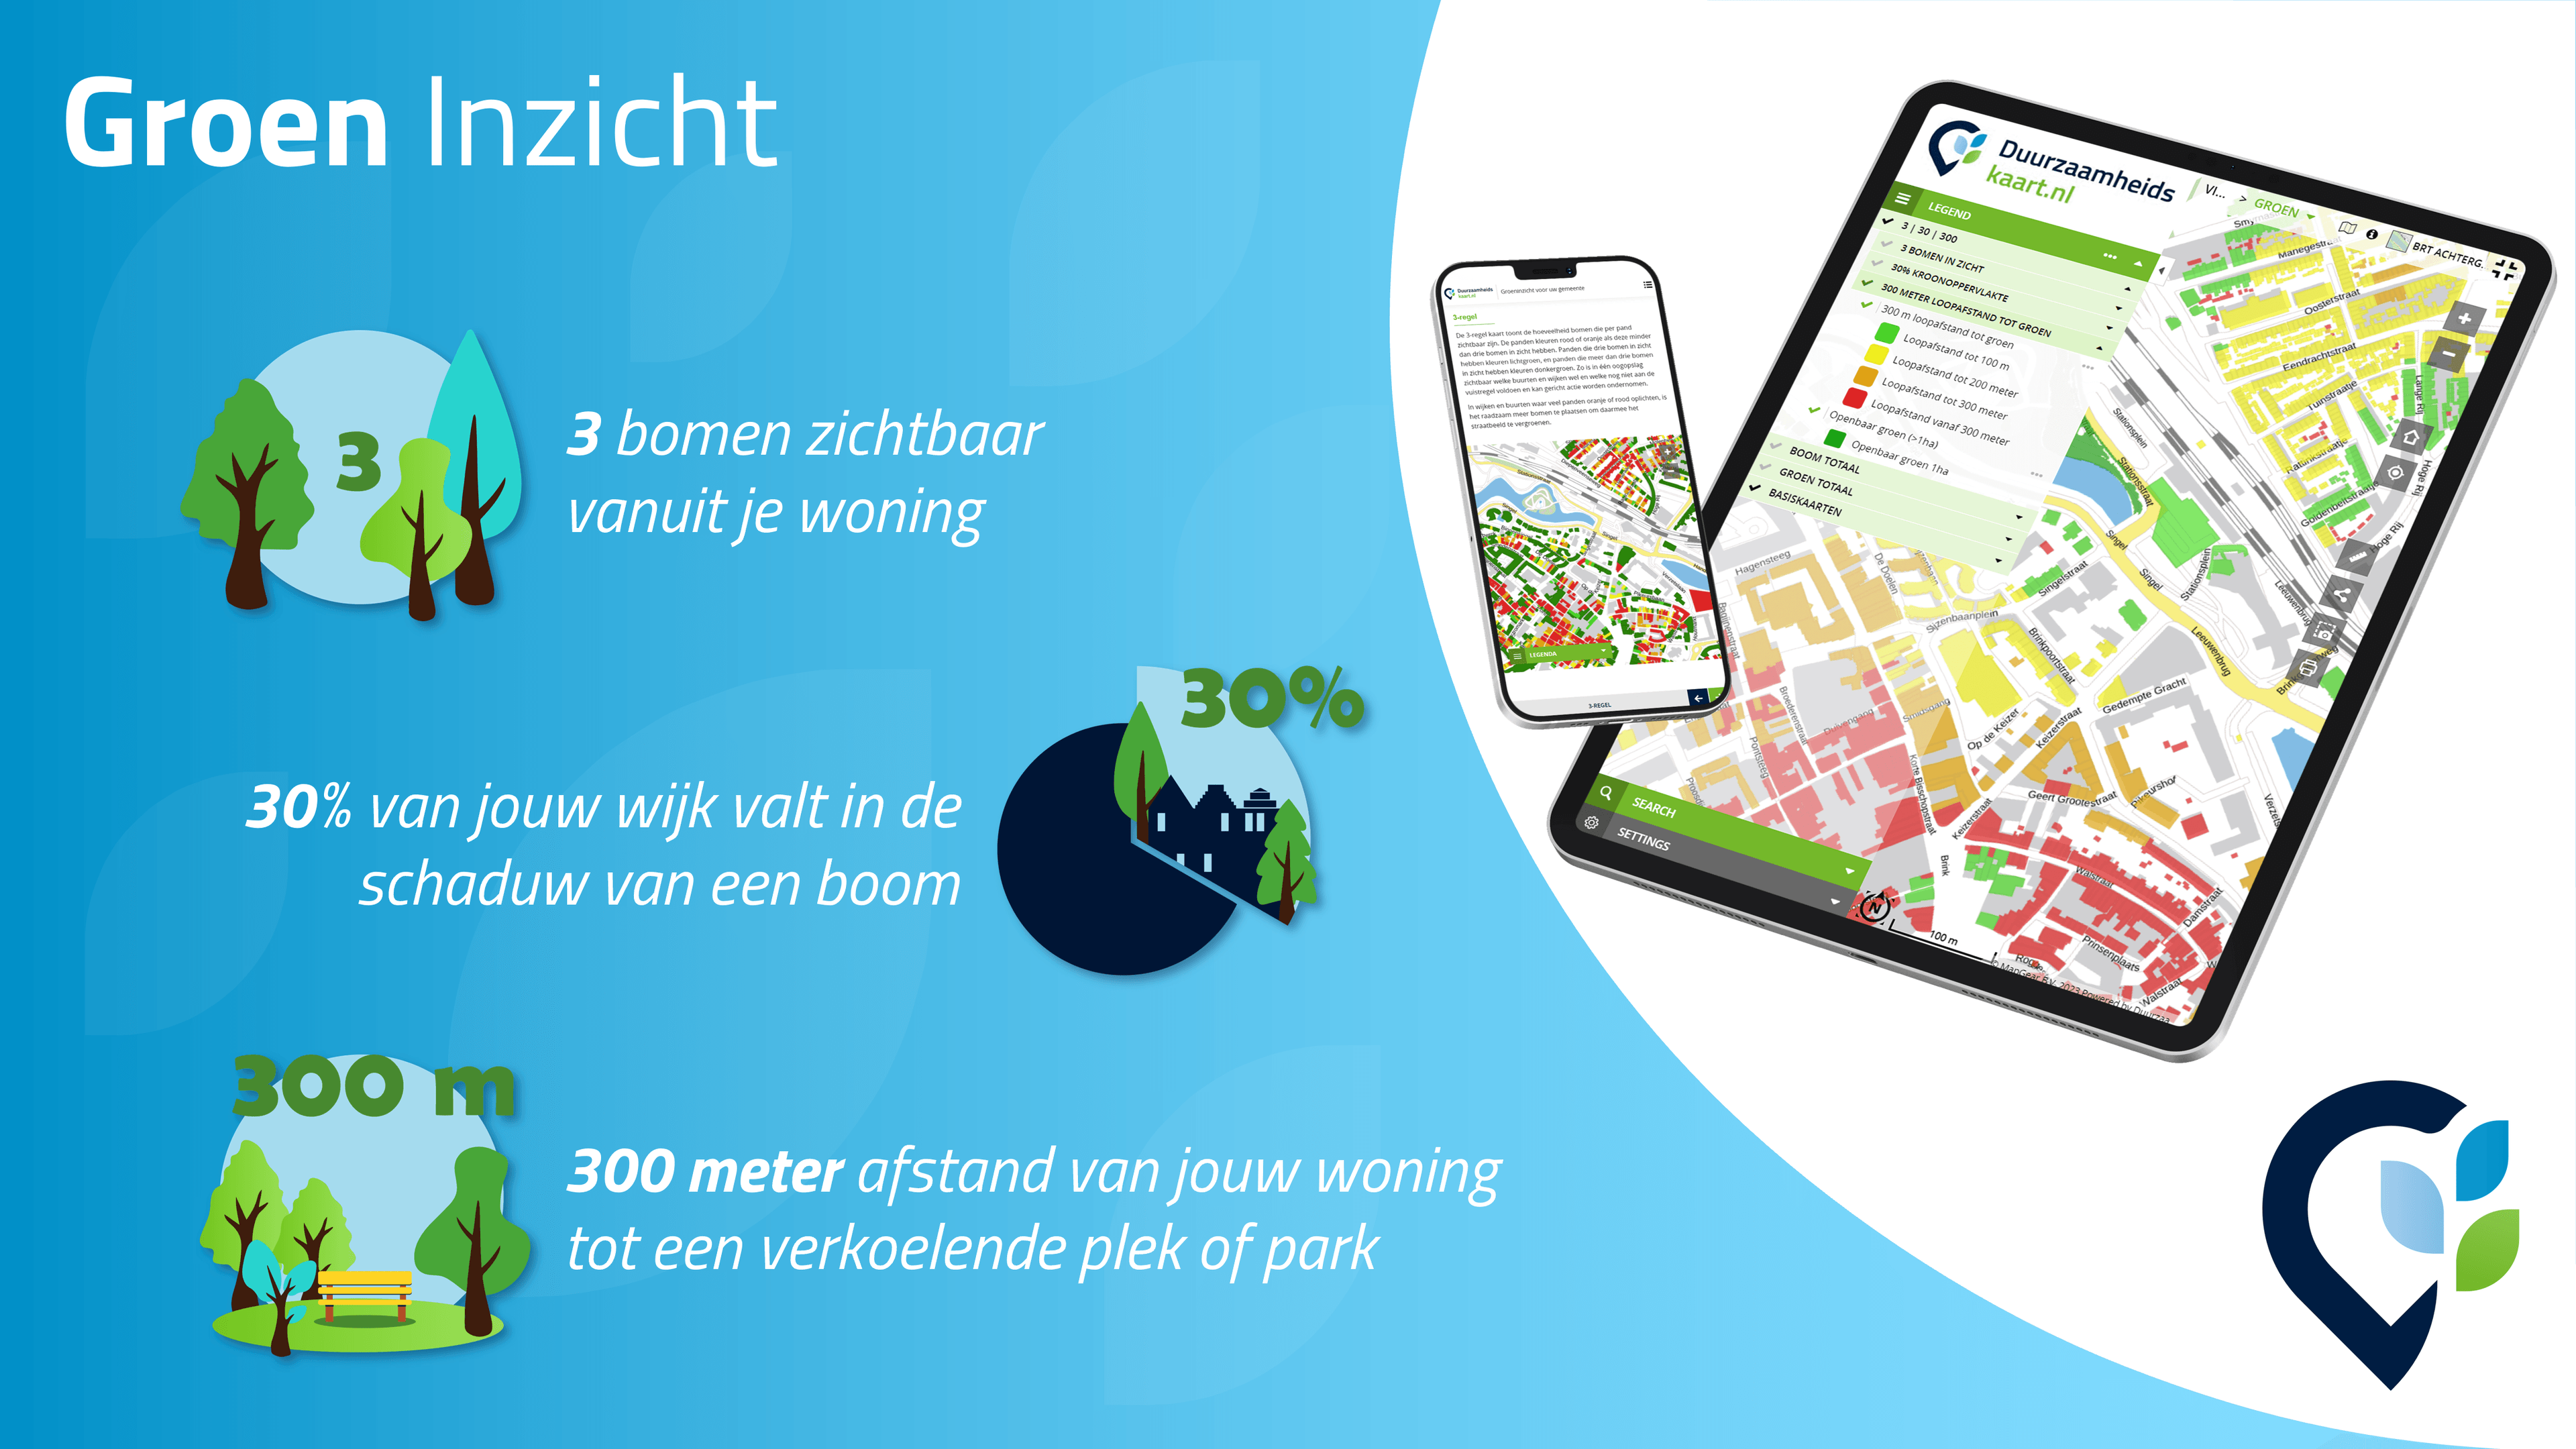
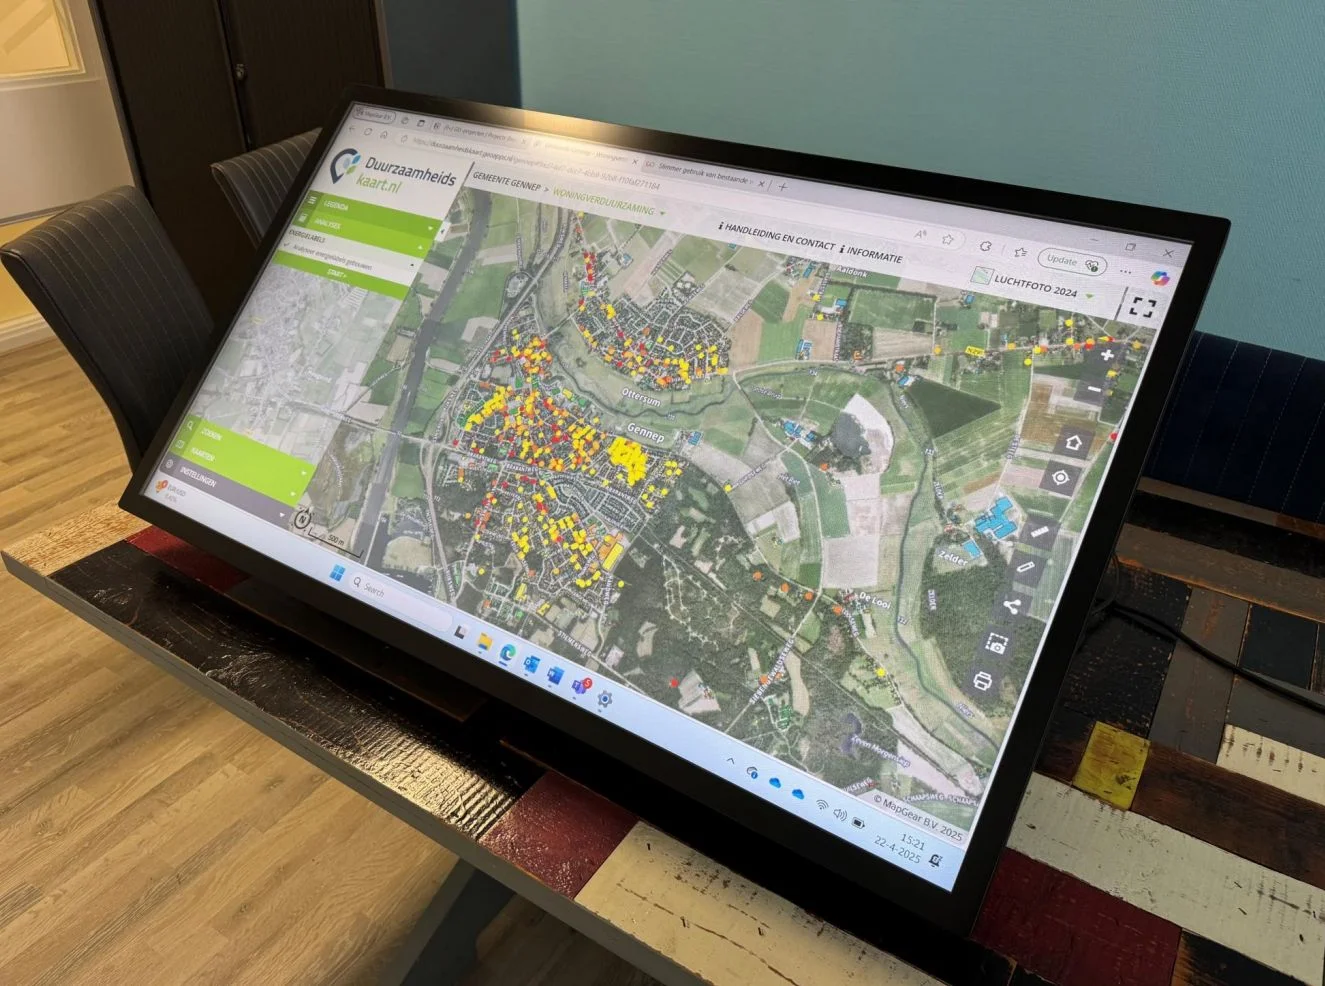
The Sustainability Map gives you current insight into where the sustainable opportunities lie in your municipality or province. Whether it is about stimulating solar energy, utilizing sustainable ambient heat, reducing heat stress or monitoring your climate adaptation objectives.
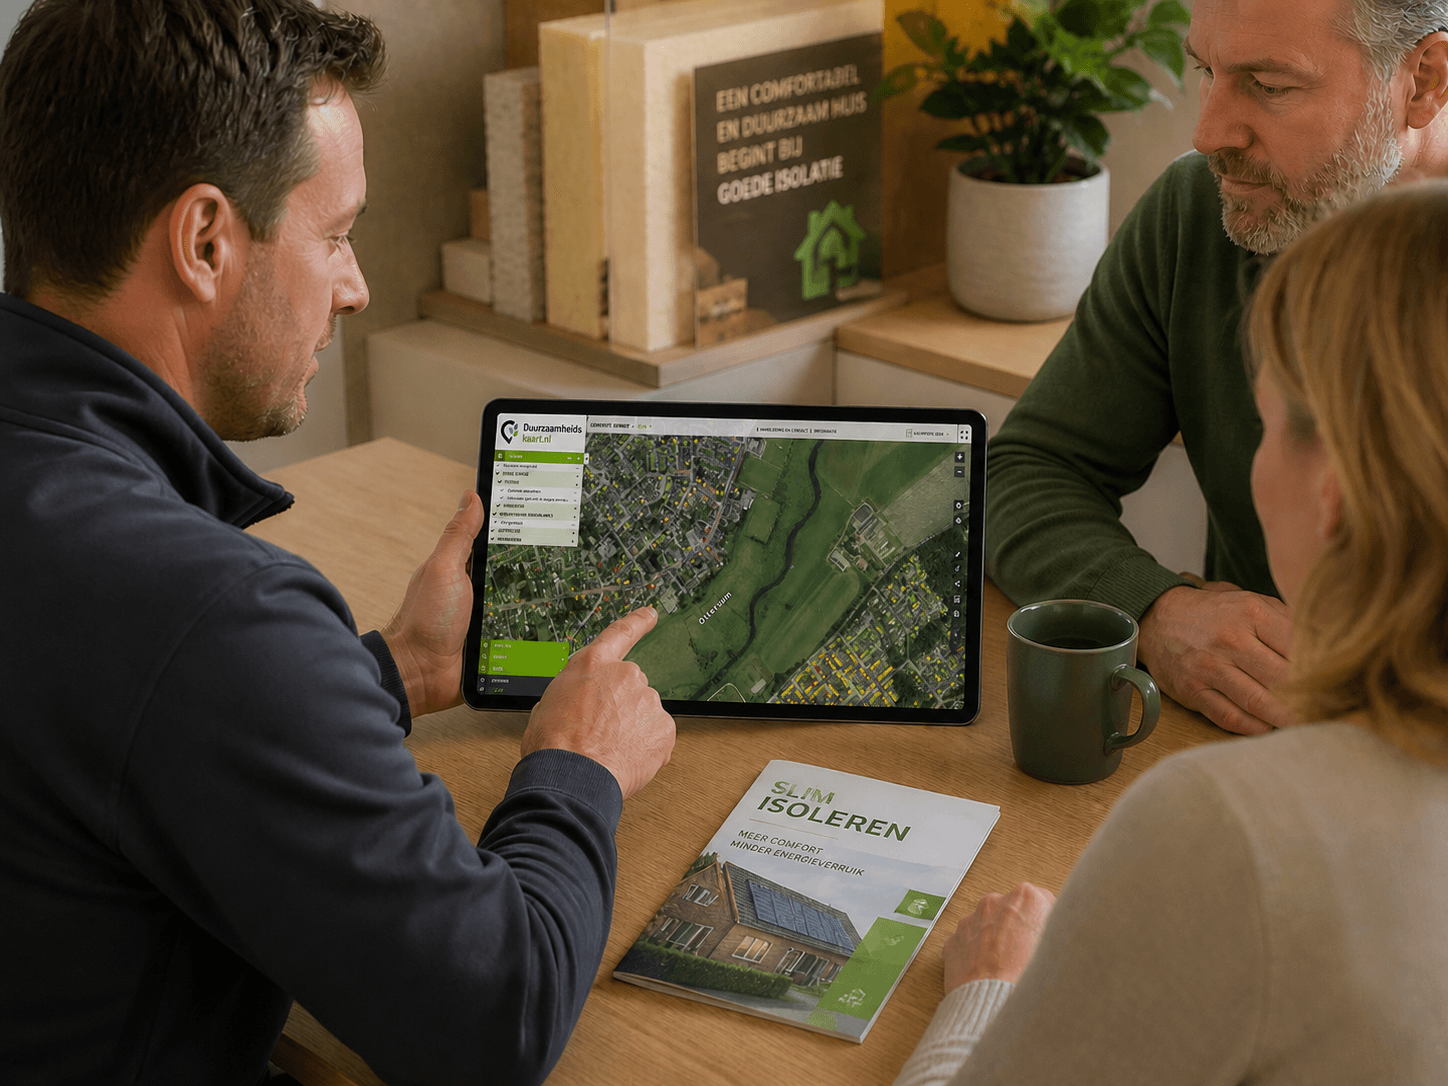
We make your sustainability data visual and clear. Always and everywhere current insight, all your data in one central place, with effective tools for analysis and monitoring. User-friendly, interactive and clear.
Why Duurzaamheidskaart?
Current insight into sustainable opportunities per location
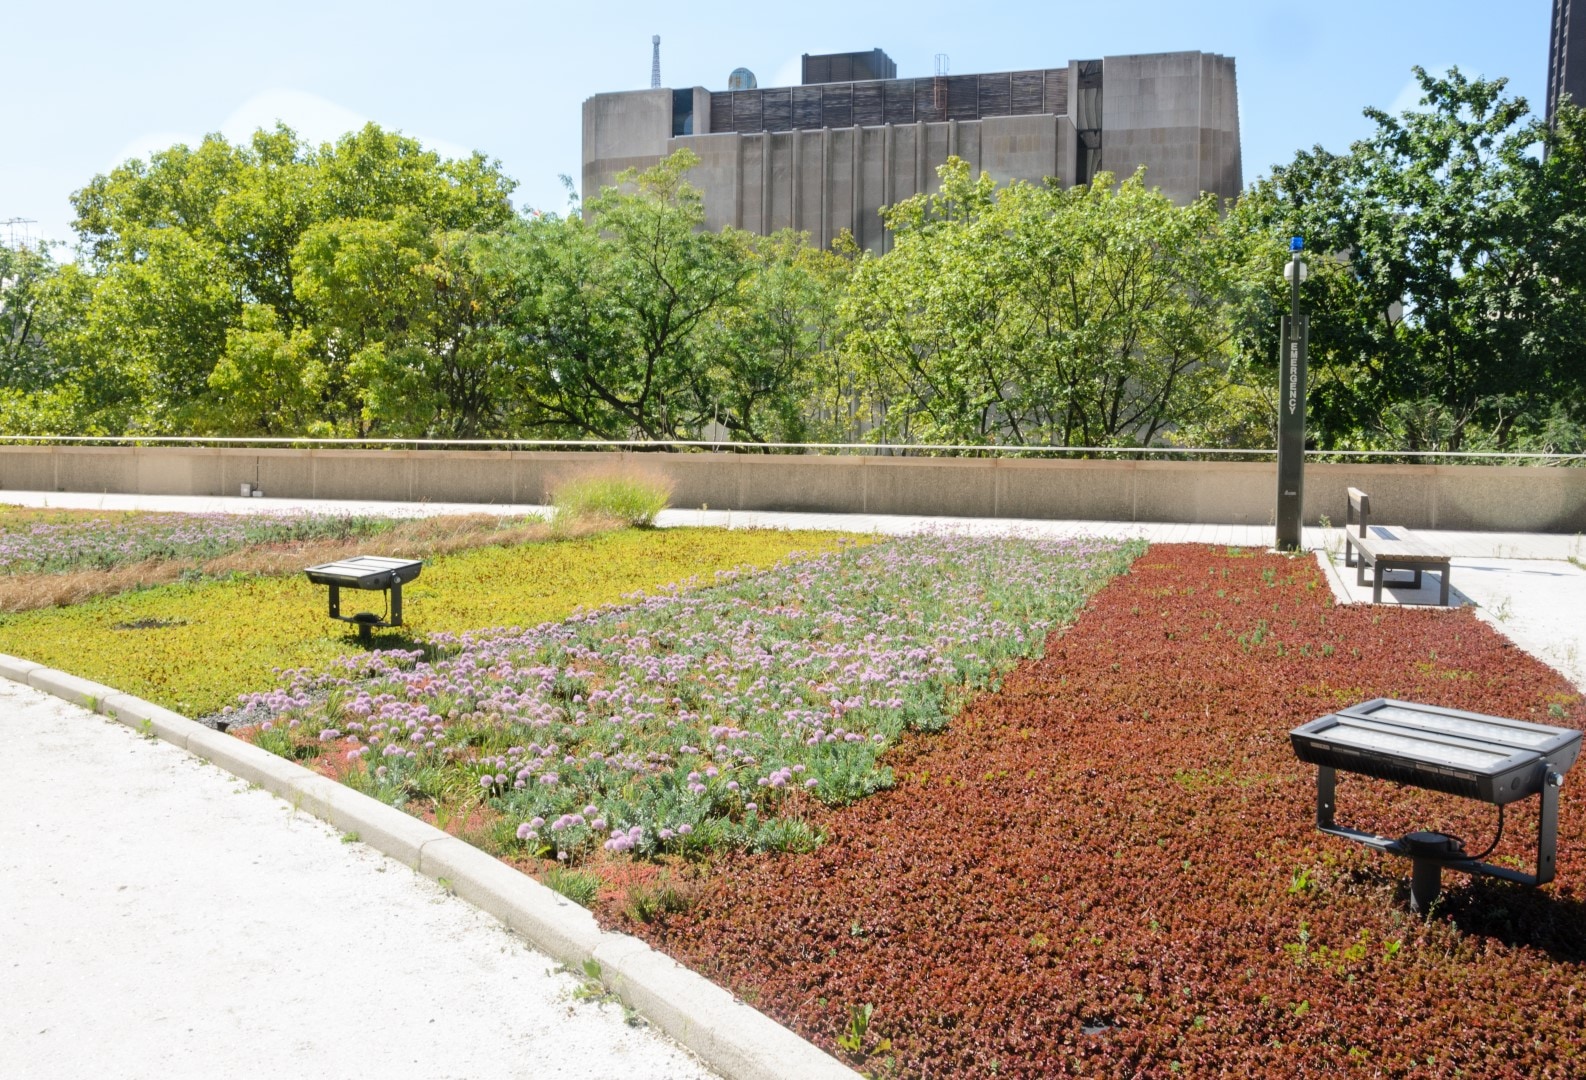
Solar energy, heat stress and climate adaptation on the map
All data in one place with powerful analysis tools
Monitoring and reporting for your objectives
Sustainable opportunities analysis
Climate adaptation monitoring


Start today with Duurzaamheidskaart
Transform your workflows with powerful Geo-ICT solutions. More than 500 organizations trust MapGear for their geographical information – with Duurzaamheidskaart as one of our solutions. Join satisfied customers worldwide.
Discover our other products
Expand your Geo-ICT toolkit with our complete range of innovative solutions
Online GIS platform for spatial intelligence across your organization
More about GeoAppsThe interactive participation tool for spatial plans and developments
More about MapTalkCatalog, tooling & hosting for real-time geodata as web services
More about MapServicesThe digital map table for trade fairs, events & workshops
More about TouchTableWant to know more?
Do you have questions and want to know more about one of our products or request a demo? Fill in the contact form so we can get in touch with you.