“Berechnungen, für die wir früher eine Woche brauchten, sind jetzt in wenigen Minuten erledigt. Das spart uns enorm viel Zeit und Geld.”
Gründachpotenzial & Begrünung
Die Gründachkarte hilft Gemeinden und Wasserbehörden, Bürger in die Begrünung einzubeziehen. Zeigen Sie eine öffentliche Karte, auf der Bürger eine Adresse eingeben können, um zu sehen, ob ihr Dach für ein Gründach geeignet ist – von leichtem Sedum bis zum intensiven Dachgarten. Fördern Sie Begrünung, verknüpfen Sie Subventionen wo möglich und unterstützen Sie die Klimaanpassung.

Gründächer fördern Nachhaltigkeit, Umwelt und Lebensqualität. Die Anfangskosten sind höher als bei einem herkömmlichen Dach, aber die Begrünung hält länger und kann danach oft recycelt werden.
Wasser
Weniger Druck auf Kanalisation
Lebensumfeld
Gesünder & grüner
Dachhaut
Längere Lebensdauer
Subventionen
Gemeinden & Wasserbehörden
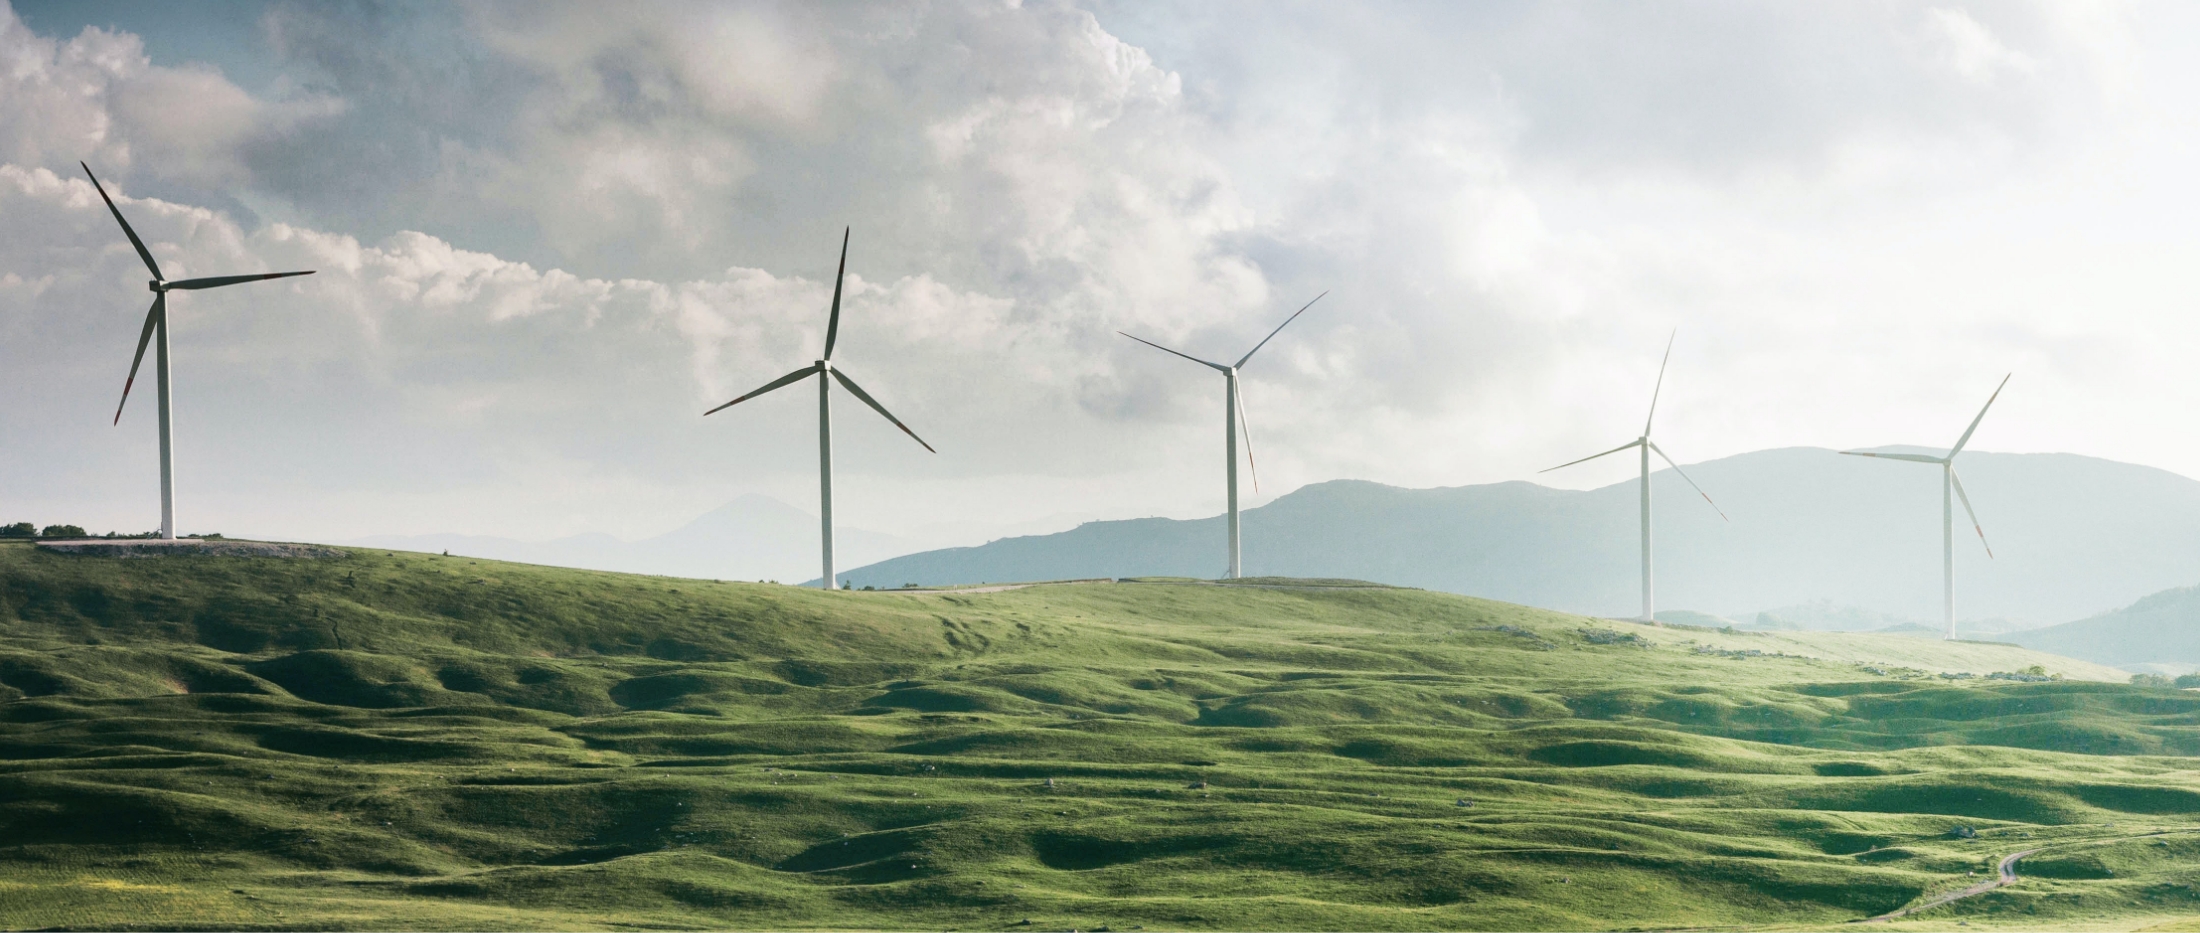
“In städtischen Gebieten kann es bis zu 10 Grad wärmer sein als in der Umgebung; Gründächer reduzieren Hitze und speichern Regenwasser.”
Gemeinden und Wasserbehörden wollen pluviale Überschwemmungen und Hitze reduzieren, aber Bürger und Eigentümer wissen oft nicht, was auf ihrem Dach möglich ist. Ohne Einblick bleibt Potenzial ungenutzt.
Bürger und Eigentümer wissen nicht, ob ihr Dach für ein Gründach geeignet ist. Ohne niederschwellige Karte bleibt die Nutzung gering.
Behörden wollen Anreize setzen oder Verpflichtungen an Einblicke knüpfen. Ohne Dach-für-Dach-Bild sind Politik und Kommunikation schwer zu begründen.
Subventionen und Kommunikation wirken besser, wenn Bürger sofort sehen, was auf ihrem Dach möglich ist. Eine Gründachkarte verknüpft Angebote mit Einblick und Reichweite.
Bürger geben ihre Adresse ein und sehen sofort Dachtauglichkeit, welcher Gründachtyp passt, indikative Investition und Vorteile für Regenwasserrückhalt und Biodiversität.
Die Karte macht Dachtauglichkeit für Bürger verständlich und für Politik nutzbar. Zeigen Sie Potenzial pro Dachfläche, erklären Sie, welcher Gründachtyp passt, und verknüpfen Sie die Information mit Kommunikation oder Subventionsprogrammen.
Demo anfragenGründächer tragen zu Regenwasserrückhalt, Klimaanpassung und einem gesünderen Lebensumfeld bei. Mit der Gründachkarte zeigen Sie Bürgern, was möglich ist, und steuern Begrünung und Subventionen.
Leichtgewichtige Vegetation mit Sedum, Kräutern, Moos und Gras. Ab ca. 40 kg/m² bei Wassersättigung. Ideal für bestehende Dächer mit begrenzter Tragfähigkeit.
Dachgarten mit Sträuchern und Bäumen, begehbar und als Grünfläche nutzbar. Erfordert stärkere Konstruktion und mehr Pflege.
Substrat und Wurzeln speichern Regenwasser und geben es langsam ab. Weniger Kanalisationsbelastung bei Starkregen.
Ein Gründach hat einen standardisierten Aufbau aus Funktionsschichten. Von unten nach oben: Abdichtung (wurzelfest), Schutzschicht, Drainageschicht, Filterschicht, Substrat als Wachstumsmedium und die Vegetationsschicht. Verschiedene Systeme können Funktionen in einer physischen Schicht kombinieren.
Eine Karte, eine Adresse: sofortiger Einblick in die Eignung für ein extensives oder intensives Gründach. Für Gemeinden und Wasserbehörden: Begrünung steuern und Subventionen wo möglich verknüpfen.
Pro Adresse oder Dachfläche: sehen Sie, ob ein Gründach möglich ist und welcher Typ (extensiv/intensiv) passt.
Einblick in den Beitrag zu Regenwasserrückhalt und Klimaanpassung. Unterstützt Politik und Kommunikation gegenüber Bürgern.
Wo Gemeinden oder Wasserbehörden Subventionen für Sedumdächer oder Dachgärten anbieten: Information und Anträge mit der Karte verknüpfen.
Die Gründachkarte verbindet sich mit der Solarkarte und Asbestdachkarte; eine Plattform für dachbezogene Nachhaltigkeit.
Aktuelle Seite
Die Gründachkarte ist Teil der DZHK-Plattform. Betrachten Sie Gründachpotenzial neben Solarenergie, Asbestdächern und anderen Nachhaltigkeitsdaten an einem Ort.
Gründachkarte
Erfahrungen von Organisationen, die mit DZHK arbeiten.
“Berechnungen, für die wir früher eine Woche brauchten, sind jetzt in wenigen Minuten erledigt. Das spart uns enorm viel Zeit und Geld.”

“Wir präsentieren unsere Expertise nicht mehr als trockene Berichte, sondern als interaktive Kartenanwendungen. Auch Menschen ohne technische Kenntnisse können sie nutzen – DZHK ist damit eine wesentliche Grundlage für die Politikgestaltung.”

“DZHK hat uns geholfen, Nachhaltigkeitsdaten für alle zugänglich zu machen. Die Plattform verbindet leistungsstarke Visualisierung mit einfacher Bedienung.”
“Gemeinsam mit MapGear (DZHK) erstellten wir eine realistische Prognose des Solarpotenzials in Groningen für 2035. Wir kombinieren Daten zu Dächern, Wärmepumpen, Elektromobilität und politischen Entscheidungen zu einem verlässlichen Zukunftsbild.”
“Gemeinsam mit MapGear (DZHK) entwickelten wir den TransitiePlanner. Er ermöglicht uns, Daten zu Energieverbrauch, Klimaanpassung und nachhaltiger Mobilität zu sammeln, zu analysieren und zu visualisieren. Wir bauen ein dynamisches Dossier für nachhaltige Gewerbegebiete auf.”
“DZHK hat uns geholfen, unsere Energiewendeprojekte effizienter zu planen und umzusetzen.”

“Mit Asbestdakenkaart haben wir erstmals einen Überblick über unsere Asbestdaten und den Sanierungsfortschritt. Ein Ort zum Priorisieren, Überwachen und Berichten.”
“Berechnungen, für die wir früher eine Woche brauchten, sind jetzt in wenigen Minuten erledigt. Das spart uns enorm viel Zeit und Geld.”
“Wir präsentieren unsere Expertise nicht mehr als trockene Berichte, sondern als interaktive Kartenanwendungen. Auch Menschen ohne technische Kenntnisse können sie nutzen – DZHK ist damit eine wesentliche Grundlage für die Politikgestaltung.”
“DZHK hat uns geholfen, Nachhaltigkeitsdaten für alle zugänglich zu machen. Die Plattform verbindet leistungsstarke Visualisierung mit einfacher Bedienung.”
“Gemeinsam mit MapGear (DZHK) erstellten wir eine realistische Prognose des Solarpotenzials in Groningen für 2035. Wir kombinieren Daten zu Dächern, Wärmepumpen, Elektromobilität und politischen Entscheidungen zu einem verlässlichen Zukunftsbild.”
“Gemeinsam mit MapGear (DZHK) entwickelten wir den TransitiePlanner. Er ermöglicht uns, Daten zu Energieverbrauch, Klimaanpassung und nachhaltiger Mobilität zu sammeln, zu analysieren und zu visualisieren. Wir bauen ein dynamisches Dossier für nachhaltige Gewerbegebiete auf.”
“DZHK hat uns geholfen, unsere Energiewendeprojekte effizienter zu planen und umzusetzen.”
“Mit Asbestdakenkaart haben wir erstmals einen Überblick über unsere Asbestdaten und den Sanierungsfortschritt. Ein Ort zum Priorisieren, Überwachen und Berichten.”
Fordern Sie eine Demo an und zeigen Sie Bürgern, welches Gründach zu ihrer Adresse passt.
Antworten auf die häufigsten Fragen zur Gründachkarte.
Vertrauen von Gemeinden, Provinzen und Organisationen in den Niederlanden und Belgien


Möchten Sie wissen, was wir für Ihre Organisation tun können? Kontaktieren Sie uns für eine unverbindliche Demo. Besondere Wünsche? Kein Problem – hinterlassen Sie Ihre Daten unten.